In today's fast-paced business world, accurate financial planning is crucial for success. One key component of this planning is break-even analysis (BEP), which helps businesses determine the point at which their total revenues equal total costs. Traditionally, this has been a complex and time-consuming process, often requiring intricate calculations in Excel. However, with the advent of AI-powered tools like Excelmatic, financial planning is becoming more efficient and accessible. In this blog post, we will explore how AI is revolutionizing break-even analysis and financial planning in Excel.
Understanding Break-Even Point (BEP)
The break-even point is a fundamental concept in finance and business. It represents the level of sales or production at which a company's total revenues cover its total costs. Beyond this point, the company starts making a profit. Understanding the BEP is essential for businesses to set realistic sales targets, manage costs, and make informed decisions.
The Break-Even Formula
To calculate the break-even point, you need to understand the basic formula:

Where:
- Fixed Costs are costs that do not change with the level of production or sales.
- Selling Price per Unit is the price at which each unit of the product is sold.
- Variable Cost per Unit is the cost that varies with each unit produced.
Traditional Break-Even Analysis in Excel
Calculating the break-even point in Excel traditionally involves several steps:
- Set Up Your Data: Create columns for Fixed Costs, Variable Costs, Selling Price per Unit, and Units Sold.
- Input Your Data: Enter the values for each of these variables.
- Create Formulas: Use Excel formulas to calculate the total costs and total revenues.
- Calculate Break-Even Point: Use the break-even formula to determine the break-even point in units.
- Visualize the Data: Create charts to visualize the relationship between costs, revenues, and the break-even point.
This process can be time-consuming and prone to errors, especially for those who are not proficient in Excel.
Excel AI: Simplifying Break-Even Analysis
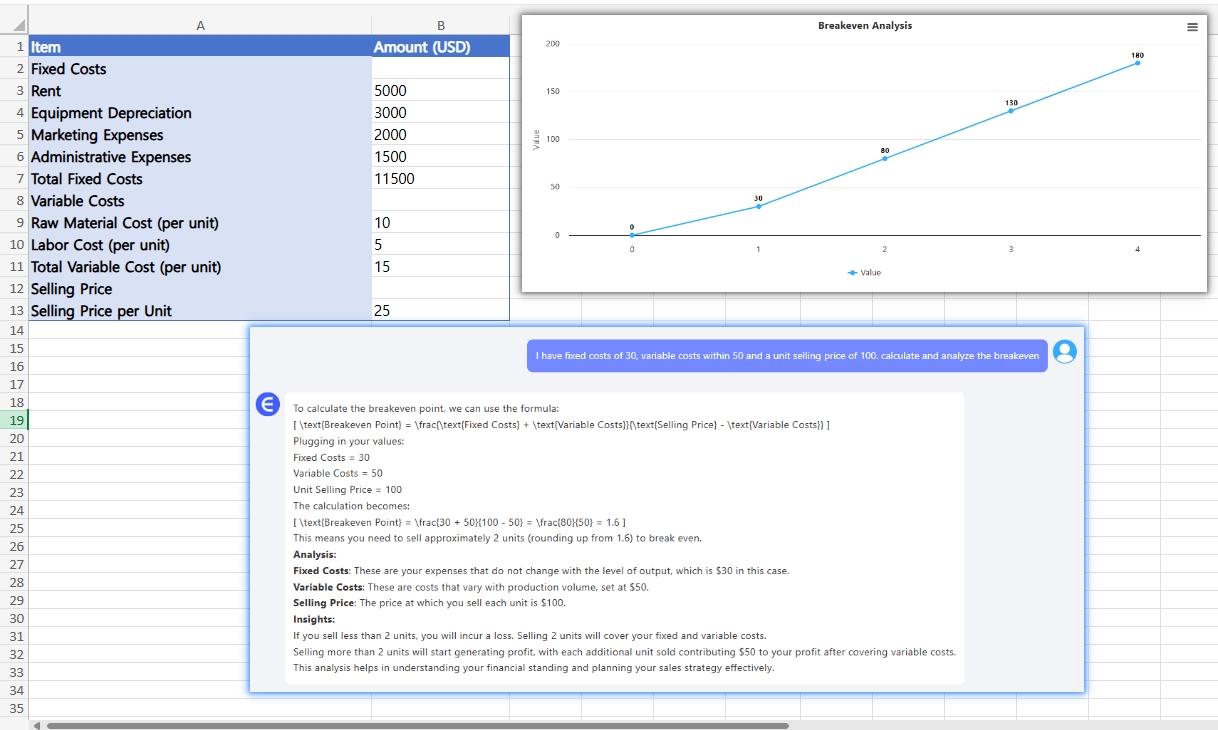
Excelmatic AI is an innovative tool that leverages artificial intelligence to simplify complex financial calculations. With Excelmatic, you can perform break-even analysis through a conversational interface, making the process more intuitive and user-friendly.
Using Excelmatic for Break-Even Analysis
- Open Excelmatic: Launch the Excelmatic application .
- Input Data: Enter your fixed costs, variable costs, and selling price per unit through a simple dialog box.
- Instant Calculation: Excelmatic will automatically calculate the break-even point using AI algorithms.
- Visualize Results: The tool will generate clear and interactive charts to visualize the break-even analysis.
Differences Between Excel AI and Traditional Excel
- Ease of Use: Excelmatic's conversational interface makes it accessible to users with little to no Excel experience.
- Accuracy: AI algorithms in Excelmatic reduce the risk of human error, ensuring more accurate results.
- Speed: Excelmatic performs calculations instantly, saving time compared to manual Excel calculations.
- Visualization: Excelmatic provides clear and interactive charts, making it easier to understand and present the data.
How to Use Excelmatic
- Register and login to the official website: Visit the Excelmatic website to Register and login.
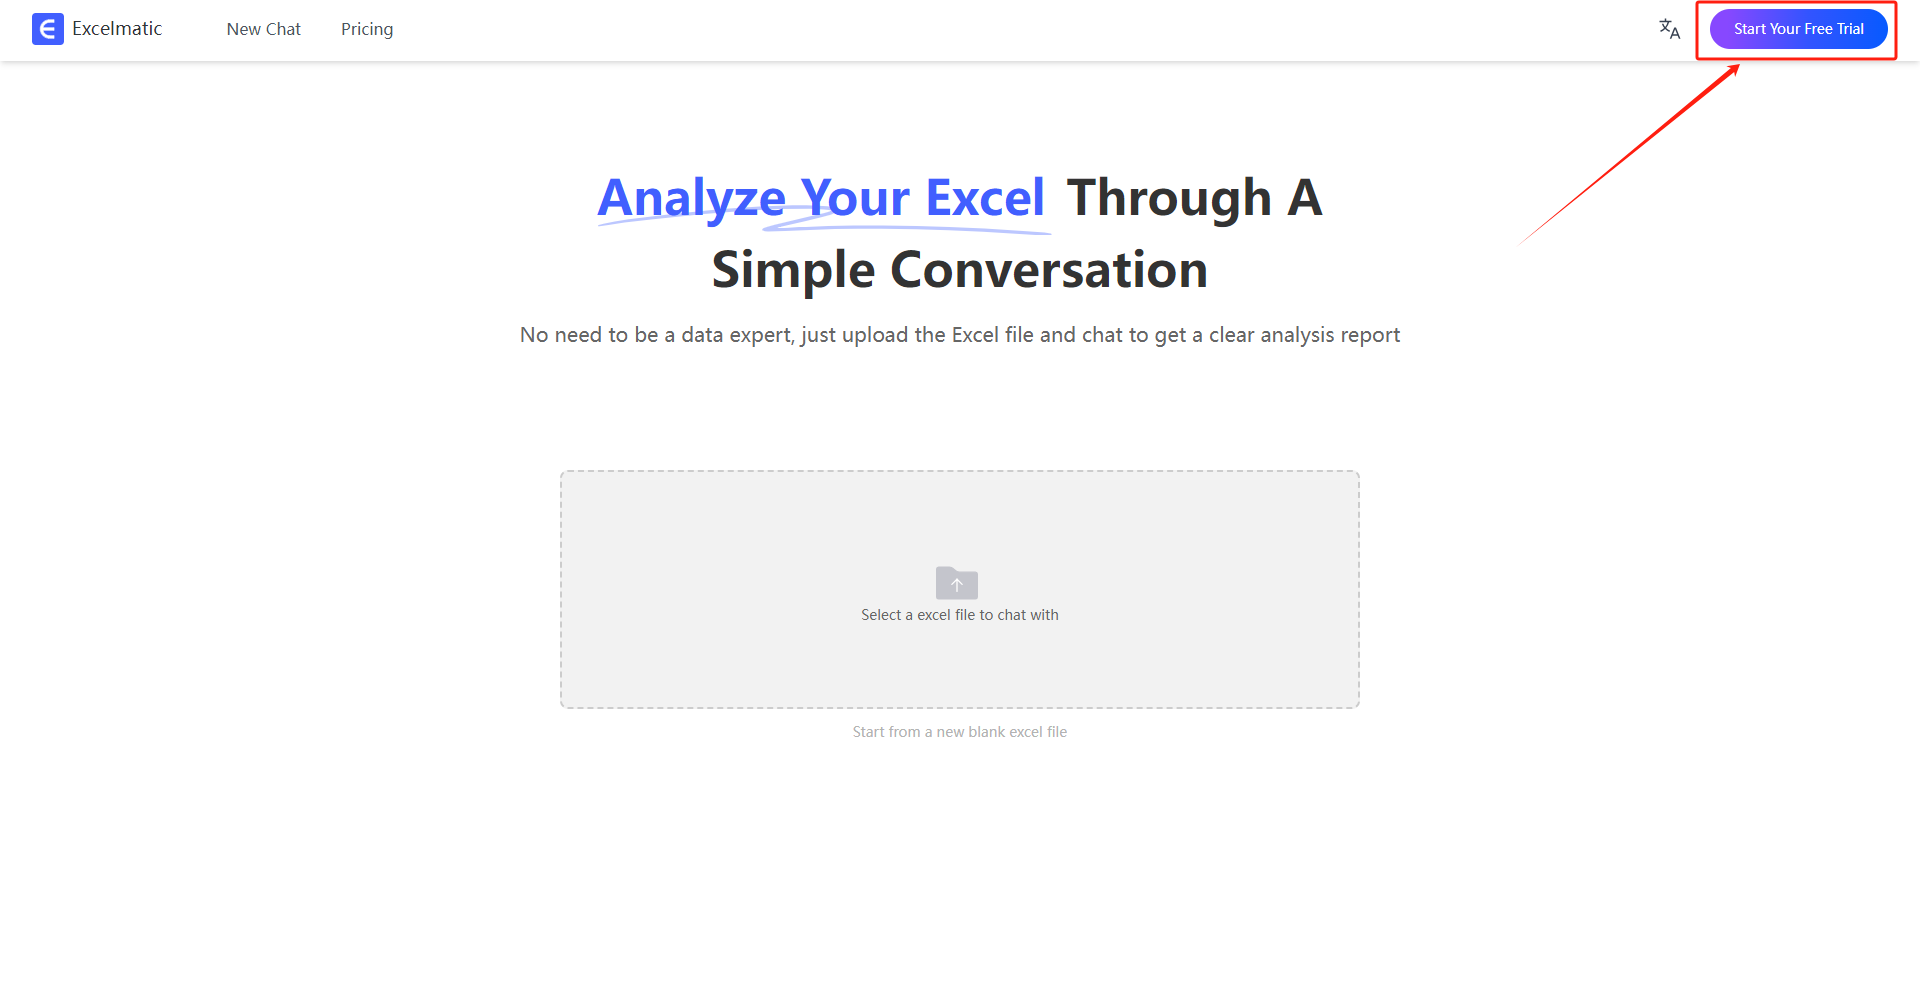
- Upload Excel Files: Upload your Excel files to Excelmatic. The system supports all common formats, including .xlsx, .xls, and .csv.

- Ask Questions in Natural Language:Once your file is uploaded, you can start asking questions in natural language.
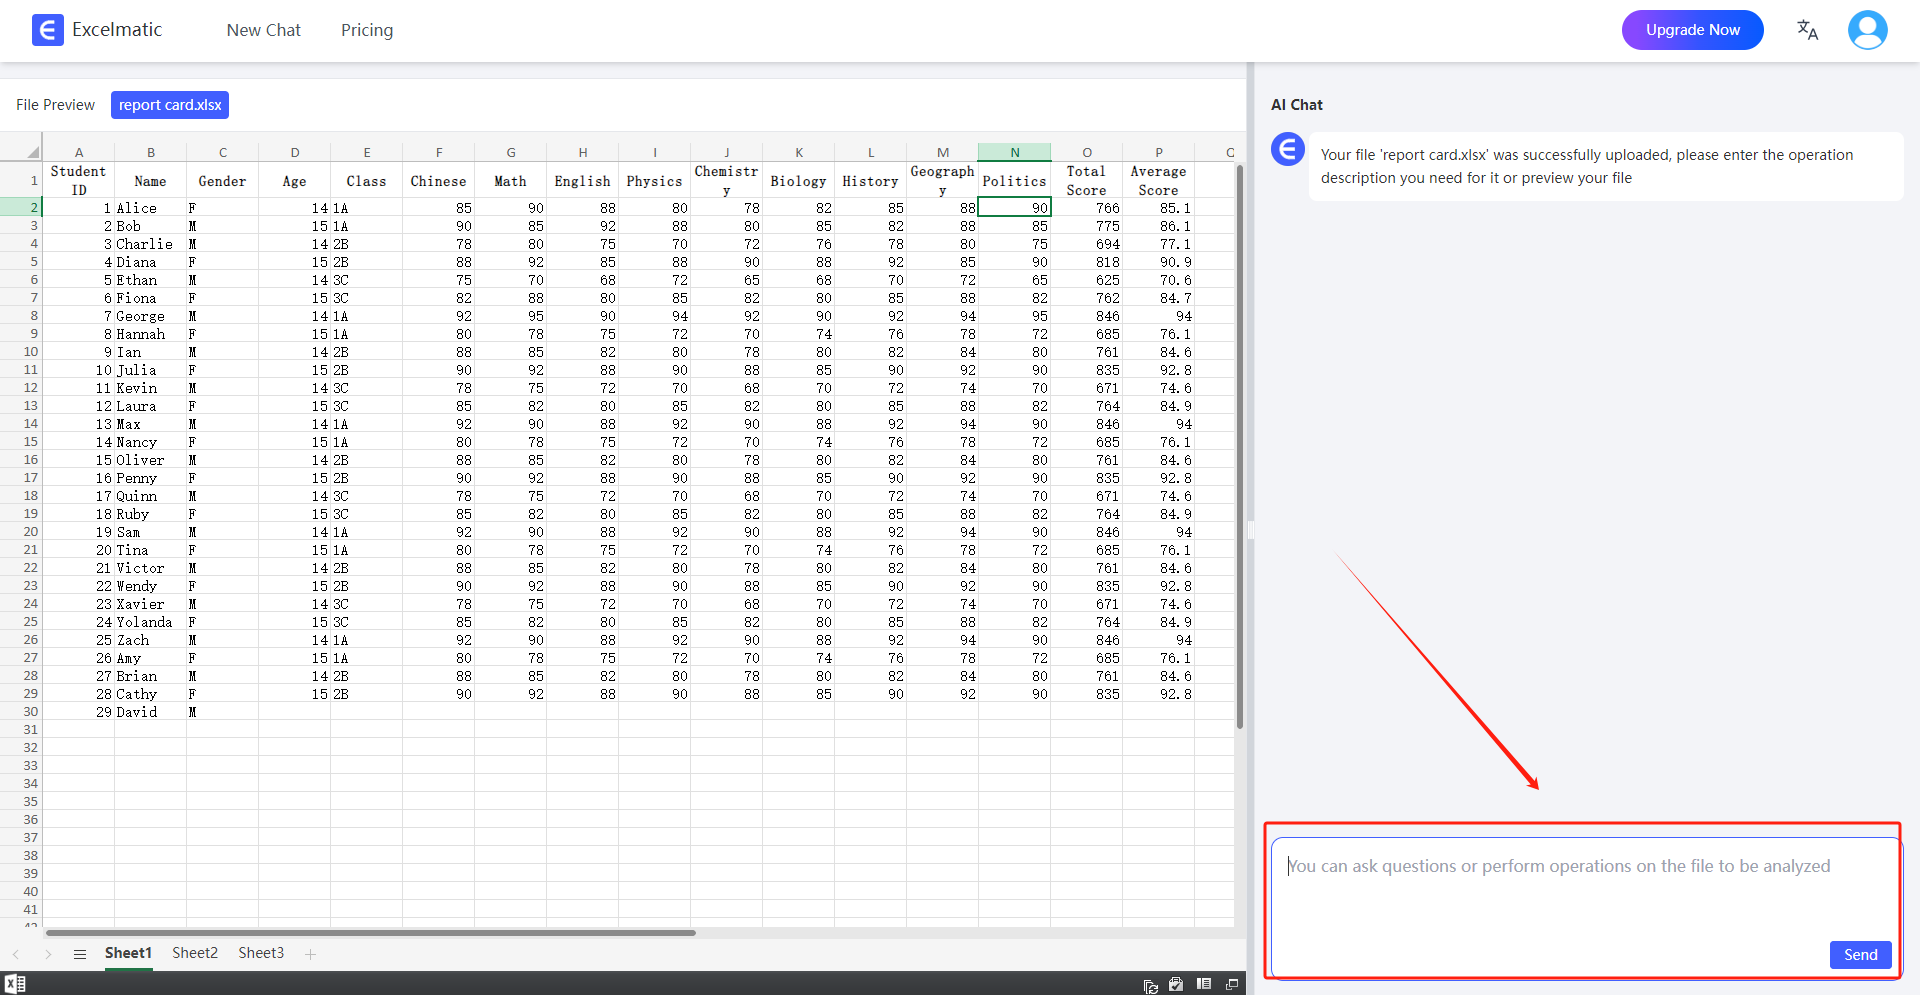
- Get Analysis Reports:Excelmatic will immediately process your request and generate detailed analysis reports. These reports highlight key metrics and trends, provide data interpretations and recommendations, and support automatic data visualization charts.

Conclusion
AI-powered tools like Excelmatic are transforming the way businesses approach financial planning. By simplifying complex calculations and providing intuitive interfaces, these tools make it easier for businesses to make informed decisions. Whether you are a financial analyst or a small business owner, Excelmatic can help you perform accurate break-even analysis with ease. Embrace the future of financial planning with Excelmatic and take your business to new heights.

