Whenever someone says Can you make a table and some charts? my first thought used to be:
How many rows? How many formulas? Am I staying late again?
Now I have a faster way. I use three AI tools that help me:
- Clean messy data with natural language
- Turn it into charts and insights instantly
- Drop those visuals straight into a presentation
Here’s how I use ChatGPT + Excelmatic + Canva to build professional spreadsheets and reports in under 30 minutes.
Step 1: Clean & standardize data with ChatGPT
Example messy table:
| Date | Product Name | Amount | Region |
|---|---|---|---|
| 2024/1/3 | iPhone 13 | $7,500 | North |
| 3-Jan-2024 | iphone13 pro | 8000元 | North |
| Jan 3 2024 | iPhone 13 promax | 7900 | BEIJING |
I pasted the above into ChatGPT and asked:
“Standardize the date format to YYYY-MM-DD, unify currency to numbers in yuan, capitalize product names, and translate regions to Chinese names.”
It replied:
| Date | Product Name | Amount (Yuan) | Region |
|---|---|---|---|
| 2024-01-03 | iPhone 13 | 7500 | north |
| 2024-01-03 | iPhone 13 pro | 8000 | north |
| 2024-01-03 | iPhone 13 promax | 7900 | north |
This cleaned version goes straight into Step 2.
Step 2: Generate charts and summaries with Excelmatic
How I use it:
- Go to Excelmatic
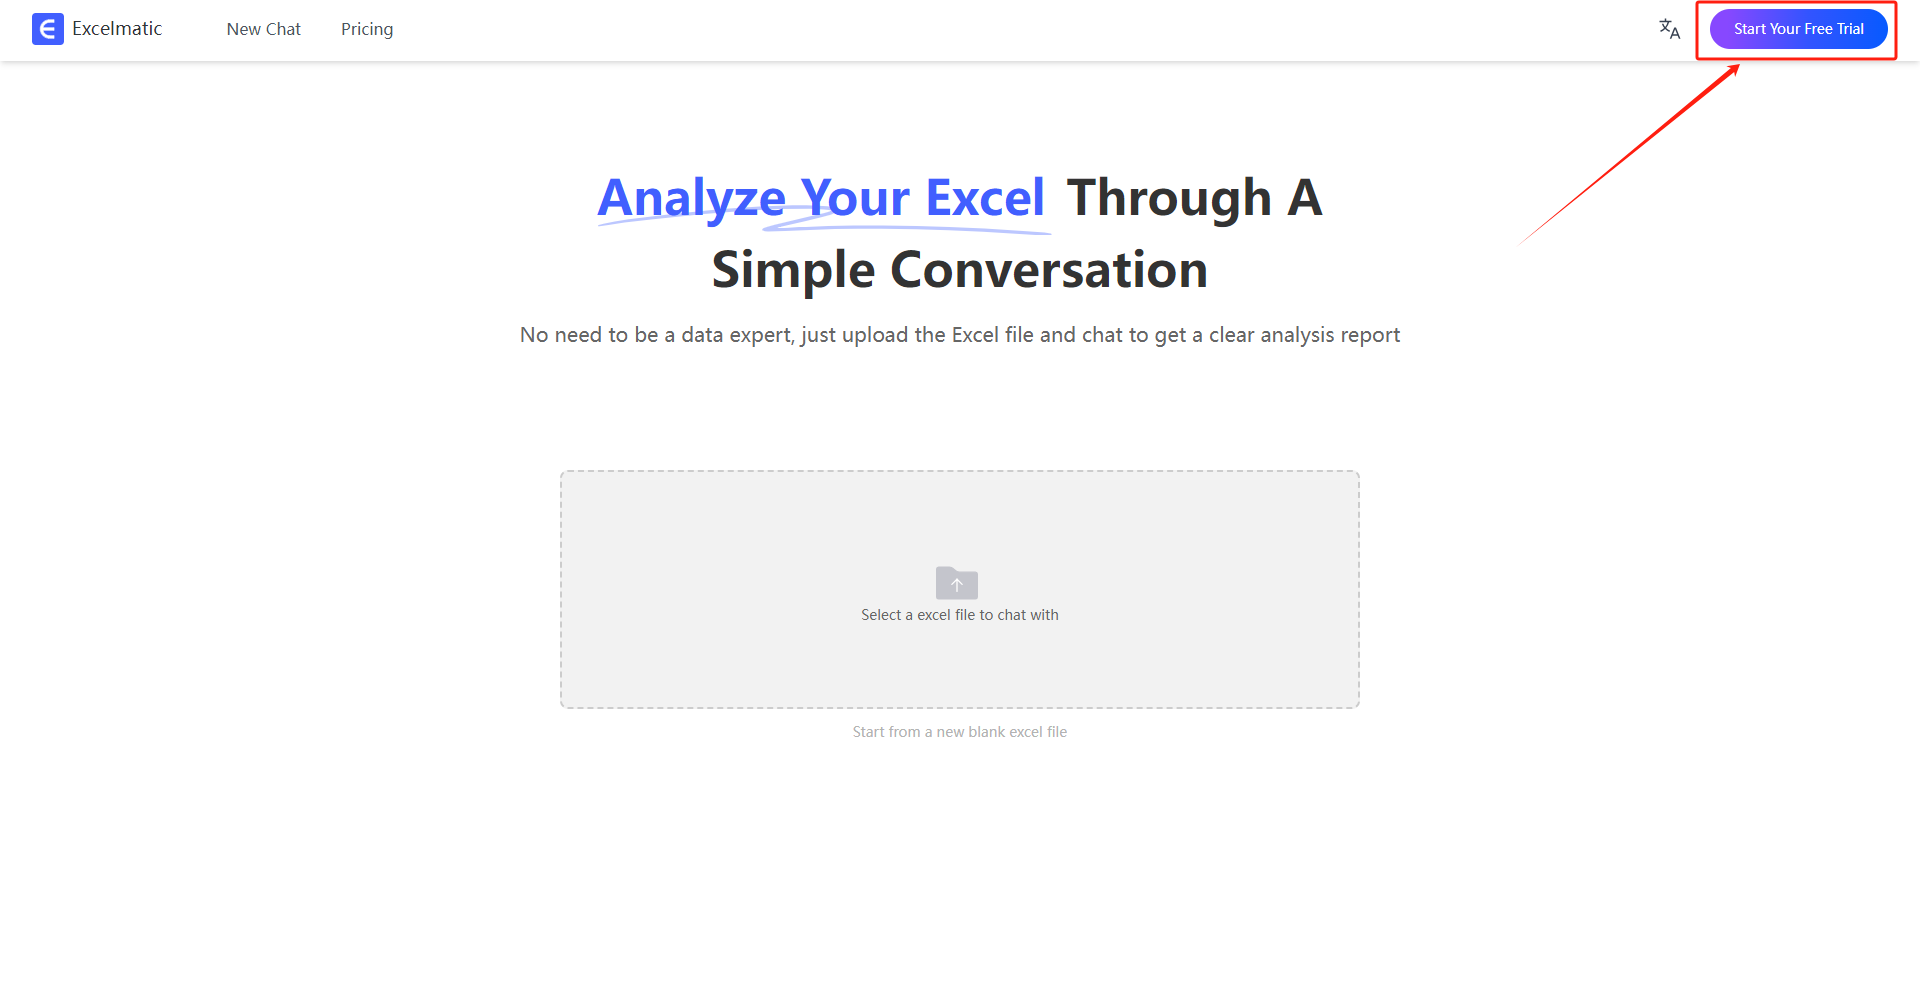
- Upload the cleaned Excel file or paste the table
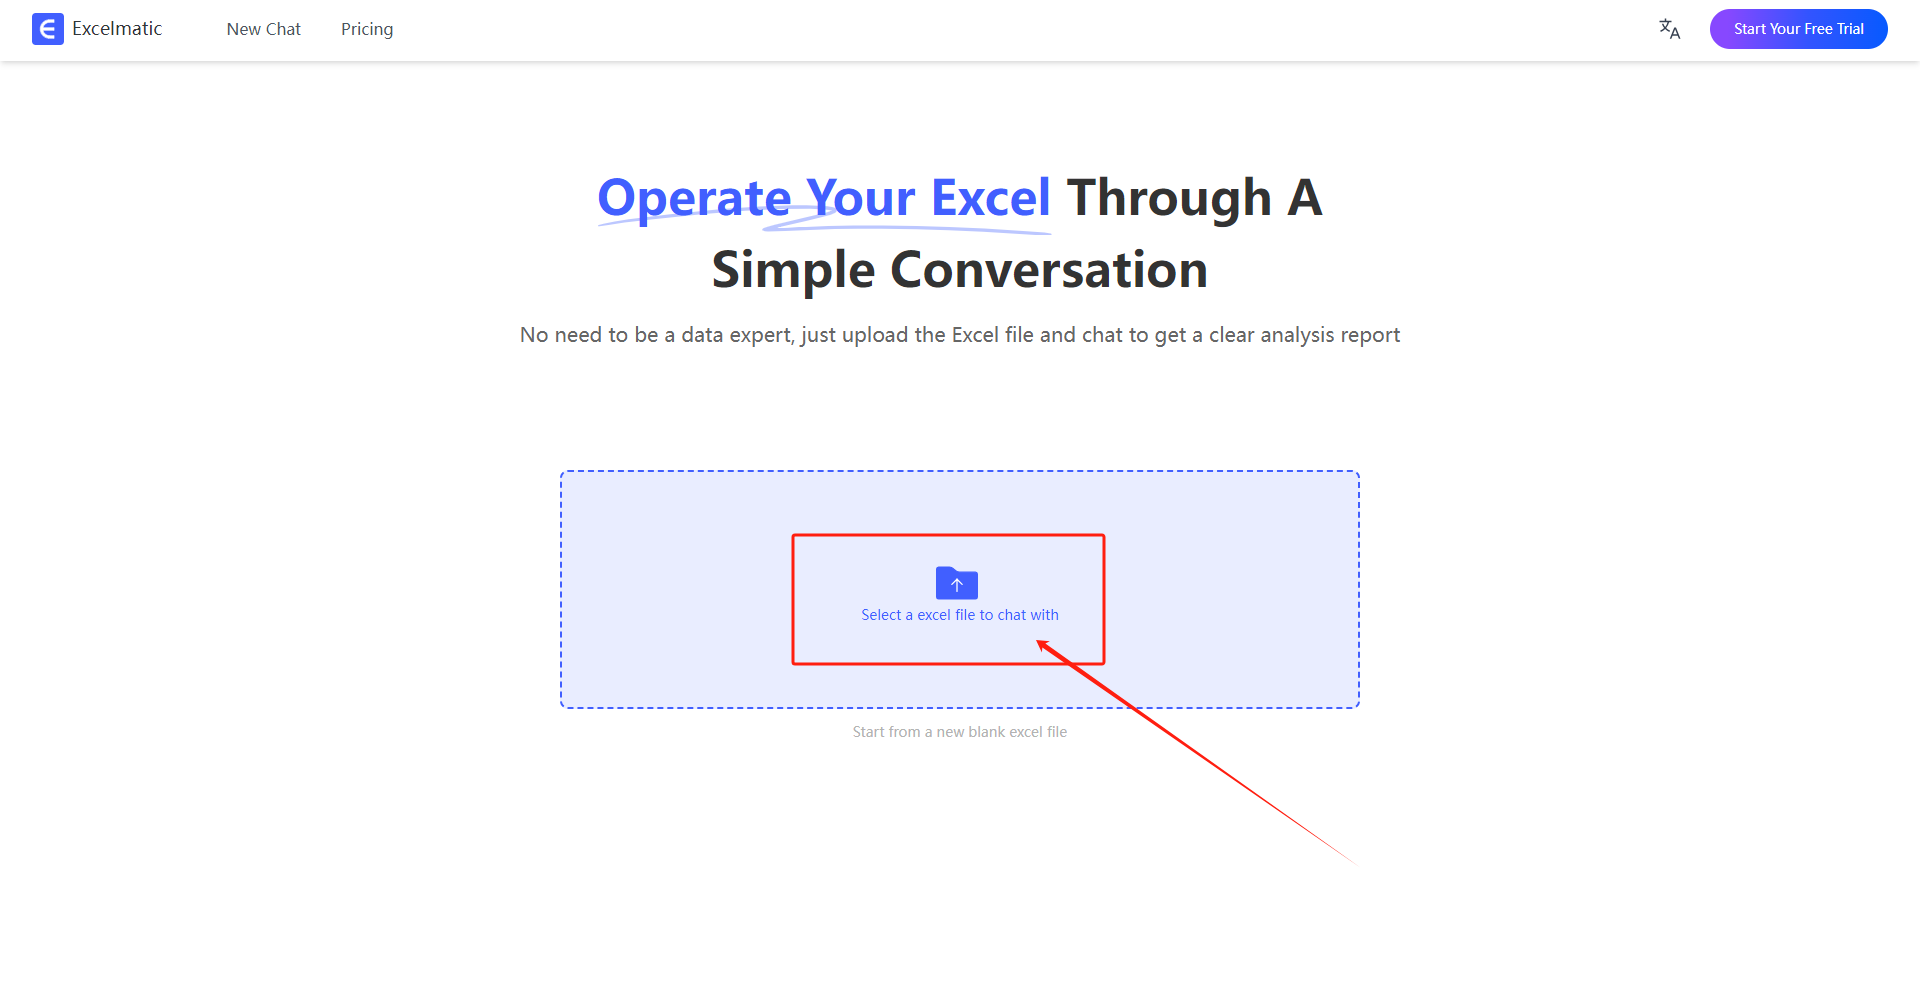
- Type something like:
“Tally the average sales for each product, generate a bar chart + summarize in one sentence.”
What Excelmatic gives me:
- Side-by-side bar chart for Revenue vs Cost
- Profit shown as a line chart overlay
- One-line summary, e.g., “Profit margin increased steadily from Jan to Mar.”
It also supports merged multi-chart exports — like showing a trendline + pie chart together.
Step 3: Turn it into a deck or report with Canva
Steps I follow:
- Go to Canva
- Search “data report” or “presentation” template
- Pick a layout, drag in Excelmatic charts (screenshot or export)
- Add headings and summary text
Use Magic Design to auto-suggest layouts based on your content
In 10–15 minutes, I have a polished deck ready to send
Final Thoughts: AI doesn’t replace your job — it removes the boring parts
Before:
- Hours cleaning data, formatting charts, summarizing trends
Now:
- ChatGPT cleans in 5 minutes
- Excelmatic builds charts + analysis in 5 more
- Canva turns it into slides in 10
Result: 3 tools, 30 minutes, no stress.
Try this combo — and start with Excelmatic, especially if you’ve got a spreadsheet waiting right now.