How to Analyze Daily Sales Data and Track Targets Using Excel

Staring at spreadsheets all day? If you're a sales manager, you know the drill: checking daily reports, comparing numbers to targets, and hunting for trends—all while trying to keep your team on track. But what if you could skip the formula headaches and get straight to insights?

In this guide, I’ll walk you through three quick ways to analyze sales data using Excelmatic, a tool that turns plain-English questions into clear reports. No coding required—just answers.


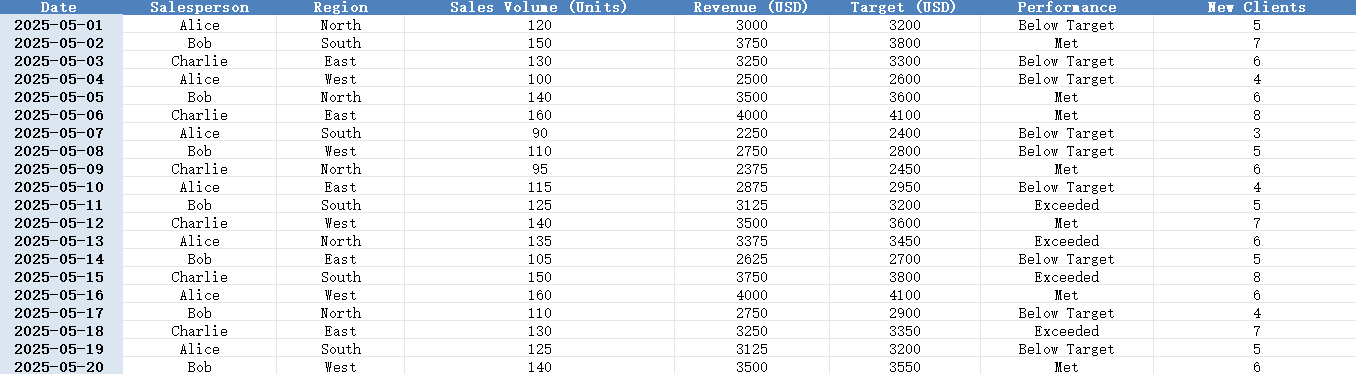
Your Data: A Typical Daily Sales Report

Here’s a snapshot of what your Excel sheet might look like:

depart


3 Real-World Tasks (Solved in Seconds)

1️⃣ Spot Who’s On Track—And Who Isn’t

Ask Excelmatic:

Show me daily performance (Actual vs. Target) for each salesperson.

What You Get:
A clean table highlighting gaps:

depart

Now you know exactly where to focus.


Ask Excelmatic:

Create a bar chart comparing daily sales volume to target.

What You Get:

depart

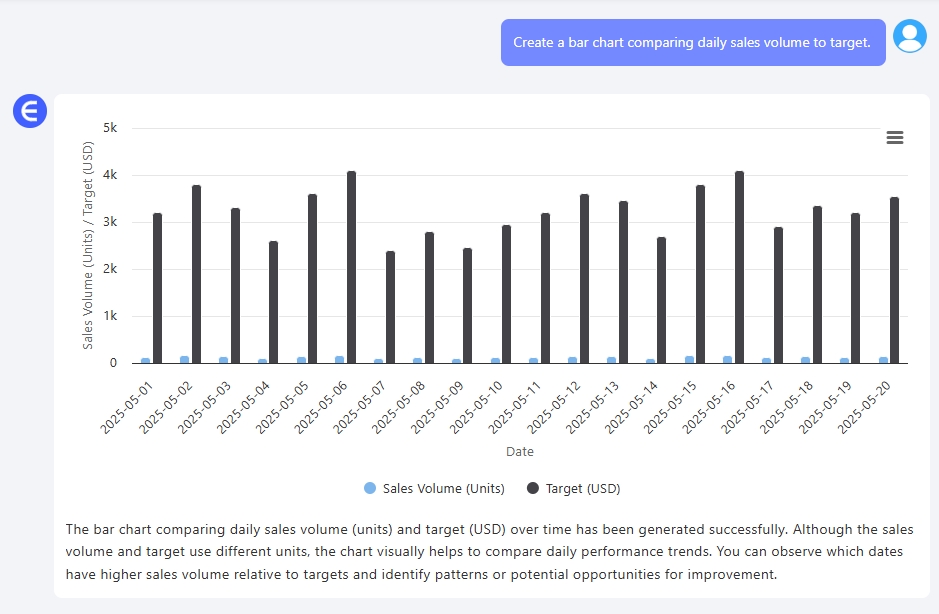
Pro Tip: Share this with your team to quickly show where they’re crushing it or falling short.


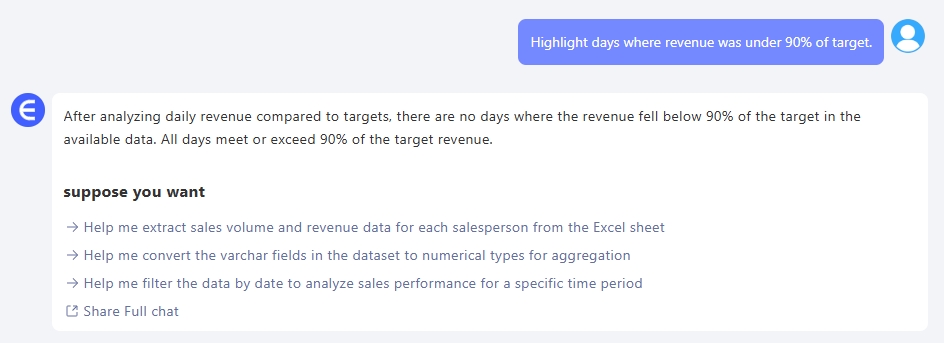
3️⃣ Flag Problem Days Automatically

Ask Excelmatic:

Highlight days where revenue was under 90% of target.

What You Get:

depart


Why This Matters

  • Save time: Ditch manual calculations and pivot tables.
  • Act faster: Catch problems early, like a repeat slump on Mondays.
  • Communicate clearly: Show your team data they’ll actually understand.

Final Thoughts

Sales tracking shouldn’t feel like detective work. With the right tools, you can spend less time crunching numbers and more time closing gaps.

Click here to see the full prompt flow and try the tool >>

Ready to simplify your workflow?Try Excelmatic now >>

Ditch Complex Formulas – Get Insights Instantly

No VBA or function memorization needed. Tell Excelmatic what you need in plain English, and let AI handle data processing, analysis, and chart creation

Try Excelmatic Free Now

Recommended Posts

How to Analyze KPI Achievement Rates Across Departments Using Excel AI
Excel Tips

How to Analyze KPI Achievement Rates Across Departments Using Excel AI

Track KPI achievement rates across departments using Excelmatic. Visualize performance and detect gaps with three easy prompts—no pivot tables required.

Sally
How to Compare Sales vs Target and Visualize Product Performance in Excel
Excel Tips

How to Compare Sales vs Target and Visualize Product Performance in Excel

Compare actual vs target sales and visualize product performance in Excel using Excelmatic. Generate charts, calculate revenue ratios, and identify sales gaps easily.

Sally
How to Analyze Campaign ROI and Performance with Excel AI Tools
Excel Tips

How to Analyze Campaign ROI and Performance with Excel AI Tools

Discover how to use Excel AI tools to review campaign ROI, trends, and performance. Find your top 5 campaigns, chart ROI over time, and calculate cost efficiency—no formulas needed.

Sally
How to Set Up an Inventory Warning System in Excel and Track Replenishment Needs
Excel Tips

How to Set Up an Inventory Warning System in Excel and Track Replenishment Needs

Track your inventory levels, flag products needing replenishment, and forecast sales remaining with simple prompts using Excelmatic—no formulas required.

Sally
Simplify Bonus and Commission Calculations with Excel AI
Excel Tips

Simplify Bonus and Commission Calculations with Excel AI

Using Excel to calculate commissions and bonuses is tedious and risky. See how Excelmatic simplifies compensation analysis with one smart question.

Sally
How to Perform a Breakeven Analysis with Excel AI
Excel Tips

How to Perform a Breakeven Analysis with Excel AI

Discover how AI is revolutionizing financial planning with Excelmatic. Learn to perform break-even analysis in Excel using traditional methods and Excelmatic's AI-powered tools. Simplify your financial planning with instant calculations and intuitive visualizations. Read more to see how Excelmatic can transform your business!

Sally