How to Analyze KPI Achievement Rates Across Departments Using Excel AI

If you're managing cross-department performance—sales, IT, HR, finance—you probably rely on KPIs to measure what matters.

But Excel doesn’t always make it easy. Building performance dashboards requires formulas like IF, MATCH, VLOOKUP, and often pivot tables. And when you're short on time, that's a problem.

In this post, I’ll show how you can track KPI achievement rates across multiple departments in just three questions—using Excelmatic, a tool that lets you query your spreadsheets like a human.


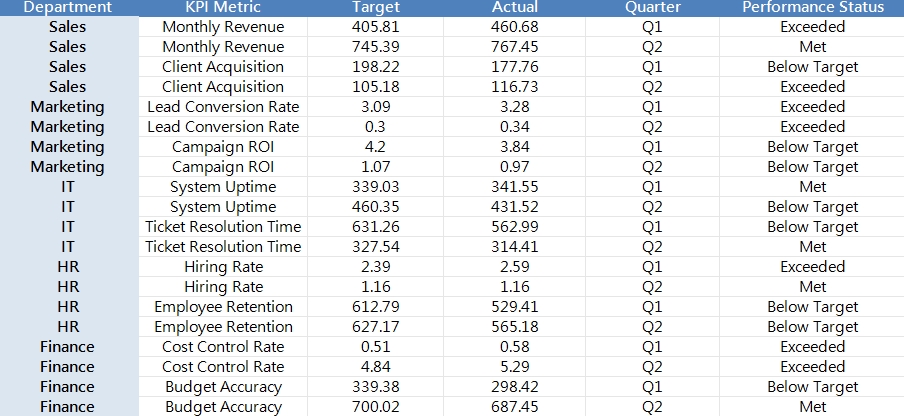
The Scenario: Departmental KPI Tracker

Here’s a sample of the performance tracking sheet we’re using:

depart


Excelmatic in Action: 3 Prompts, Full Insight


1️⃣ Calculate KPI Achievement Rate

Prompt: Please calculate the KPI achievement rate for each department and metric.

💡 Result: Excelmatic adds a new column:

depart

Now you know how far above or below each department performed. Much clearer than just “Met” or “Below”.


2️⃣ Visualize Target vs Actual for Every KPI

Prompt: Please create a bar chart showing target vs actual for each KPI metric.

💡 Result: A clean side-by-side chart showing:

depart

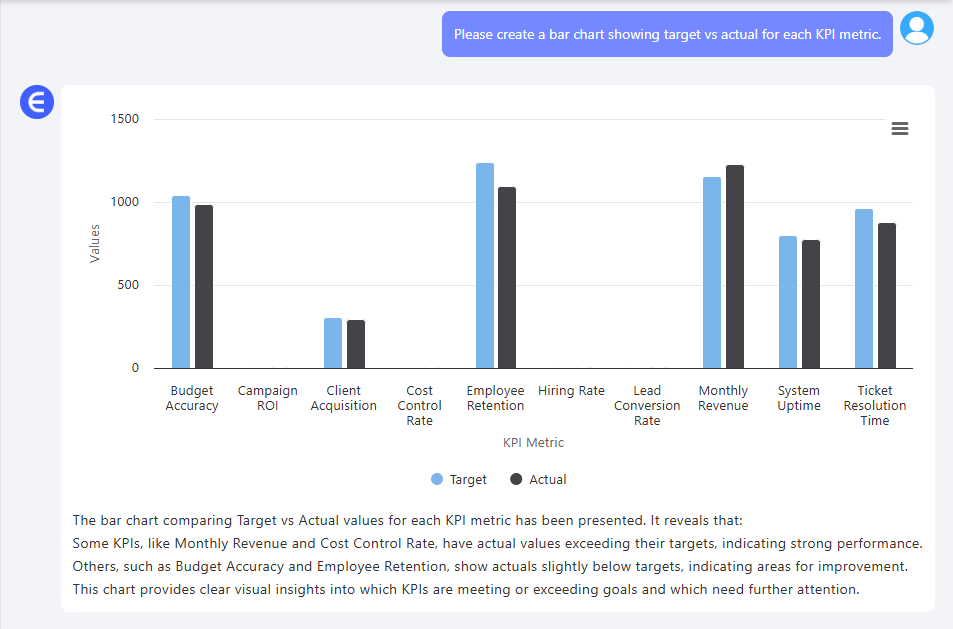
  • Monthly Revenue (Target: 100K, Actual: 105K)
  • Lead Conversion Rate (Target: 0.25, Actual: 0.22)
  • Ticket Resolution (Target: 48h, Actual: 52h)

This helps you instantly spot overperformance or gaps.


3️⃣ Quarterly Performance Distribution

Prompt: Please group results by quarter and show performance distribution (Met, Exceeded, Below).

💡 Result:

depart

This tells you how each quarter is trending. For example, Q2 had more KPIs that were exceeded, while Q1 had more misses.


What This Tells You

  • Which departments consistently exceed KPIs
  • Which metrics are underperforming and may need review
  • How team performance trends quarter to quarter
  • Where to focus attention in your next performance review

All this without creating pivot tables, helper columns, or complex formulas.


Final Thoughts

Cross-department KPI tracking doesn’t need to be a manual chore. With Excelmatic, you just ask questions and get instant results that help you monitor performance clearly and confidently.

Click here to see the full prompt flow and try the tool >>

Want to try this with your own performance sheet?Try Excelmatic now >>

Ditch Complex Formulas – Get Insights Instantly

No VBA or function memorization needed. Tell Excelmatic what you need in plain English, and let AI handle data processing, analysis, and chart creation

Try Excelmatic Free Now

Recommended Posts

How to Analyze Daily Sales Data and Track Targets Using Excel
Excel Tips

How to Analyze Daily Sales Data and Track Targets Using Excel

Use Excel to track daily sales, visualize performance vs target, and identify underperforming days. No formulas required.

Sally
How to Analyze Campaign ROI and Performance with Excel AI Tools
Excel Tips

How to Analyze Campaign ROI and Performance with Excel AI Tools

Discover how to use Excel AI tools to review campaign ROI, trends, and performance. Find your top 5 campaigns, chart ROI over time, and calculate cost efficiency—no formulas needed.

Sally
How to Set Up an Inventory Warning System in Excel and Track Replenishment Needs
Excel Tips

How to Set Up an Inventory Warning System in Excel and Track Replenishment Needs

Track your inventory levels, flag products needing replenishment, and forecast sales remaining with simple prompts using Excelmatic—no formulas required.

Sally
How to Compare Sales vs Target and Visualize Product Performance in Excel
Excel Tips

How to Compare Sales vs Target and Visualize Product Performance in Excel

Compare actual vs target sales and visualize product performance in Excel using Excelmatic. Generate charts, calculate revenue ratios, and identify sales gaps easily.

Sally
How to Perform a Breakeven Analysis with Excel AI
Excel Tips

How to Perform a Breakeven Analysis with Excel AI

Discover how AI is revolutionizing financial planning with Excelmatic. Learn to perform break-even analysis in Excel using traditional methods and Excelmatic's AI-powered tools. Simplify your financial planning with instant calculations and intuitive visualizations. Read more to see how Excelmatic can transform your business!

Sally
Invoice Tracking in Excel AI: From Manual Mess to AI-Powered Clarity
Excel Tips

Invoice Tracking in Excel AI: From Manual Mess to AI-Powered Clarity

Analyzing invoices in Excel doesn't have to be messy. See how AI tools like Excelmatic clean, summarize, and audit invoice data in just three questions.

Sally