I used to be a pivot table person. Every report started with:
- Insert → Pivot Table
- Drag fields into rows, columns, values
- Filter, re-sort, group
- Realize I picked the wrong metric
- Redo everything
That was just to get a halfway-decent summary. Then I’d spend another 20 minutes building a chart — and another 10 explaining what the chart means.
Now I do this instead:
- Upload my Excel file to Excelmatic
- Type a prompt like “Show revenue by product and give a quick summary”
- Copy the charts + insights into my deck
That’s it.
This is the Excel AI I now use every single week — and why it’s replaced 90% of my pivot table work.
A Real Report Task: Product Revenue Breakdown
Here’s the spreadsheet I got on Monday:
| Date | Product | Revenue | Region |
|---|---|---|---|
| 2024-04-01 | Alpha | 12000 | East |
| 2024-04-01 | Beta | 9500 | East |
| 2024-04-02 | Alpha | 14000 | West |
| 2024-04-02 | Beta | 10000 | West |
Traditional Way (Pivot Table Route):
- Insert pivot table → drag
Productto Rows,Revenueto Values - Add
Dateto Filters (if I want to analyze daily) - Add
Regionto Columns to compare East vs West - Right-click, format values to currency
- Insert a clustered column chart
- Realize I want the chart by date not by region, go back and re-drag fields
⏱ Time spent: ~15–20 mins
Excelmatic Way:
I uploaded the file and typed:
“Compare daily revenue by product and regionCreate charts and analyze.”
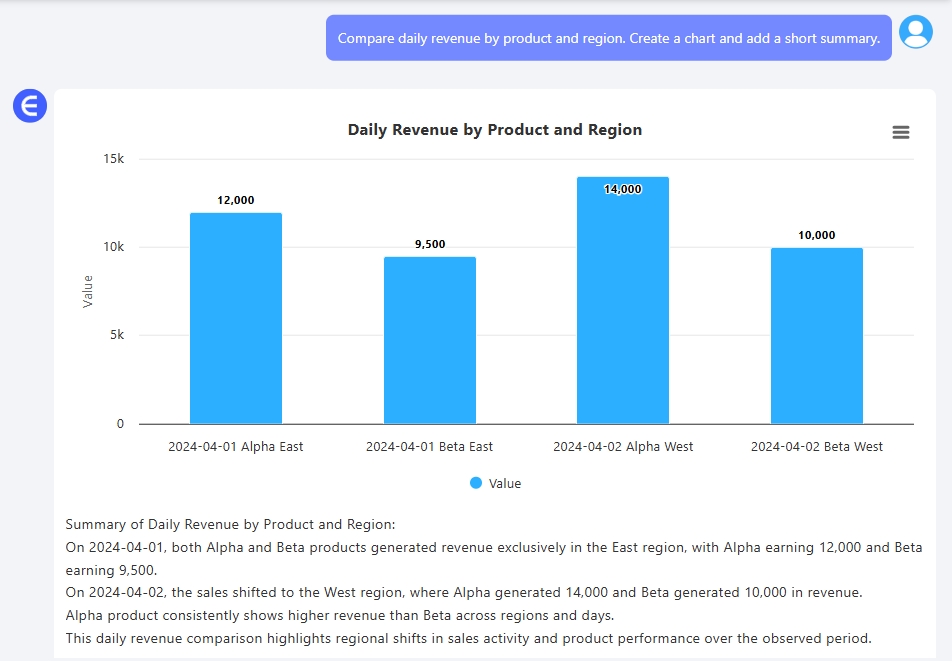
It gave me:
- A grouped column chart (Alpha and Beta by region, by date)
- A 2-line summary:
Alpha had higher average daily revenue, especially in the West.
⏱ Time spent: ~1 minute
What Makes Excelmatic Different
- You don’t build charts — you ask for them
- You don’t drag fields — you describe your need
- You don’t summarize data — it writes the insight
It’s like pivot tables… if pivot tables could think.
When I Use ChatGPT First
Sometimes the raw Excel is messy:
- Dates are mixed formats
- Regions are inconsistent (“east”, “EAST”, “East”)
- Product names are too long or inconsistent
That’s when I open ChatGPT first and ask:
“Clean this table: unify date to YYYY-MM-DD, standardize region names, shorten product names.”
Then I upload the cleaned version to Excelmatic.
Prompt Ideas I Use Weekly
Show sales by channel over the last 7 days. Use a line chart.What are the top 5 products by revenue? Pie chart + summary.Compare cost vs revenue by department. Use a bar chart + write a 1-sentence insight.
You don’t need formula knowledge. You just need to know what you want to see.
Final Thought
Pivot tables aren’t bad. But they’re slow, fragile, and not built for people who just want answers.
Excelmatic makes Excel feel like a conversation. You ask. It answers — with charts.
Try Excelmatic free › — especially if your next pivot table looks more like a puzzle than a plan.