Let’s say you’ve been asked to analyze how well each department is sticking to its monthly budget. Sounds simple? Not quite.
The spreadsheet you're handed looks like this: 6 departments, 6 months, and for each line—a budget and actual expense.
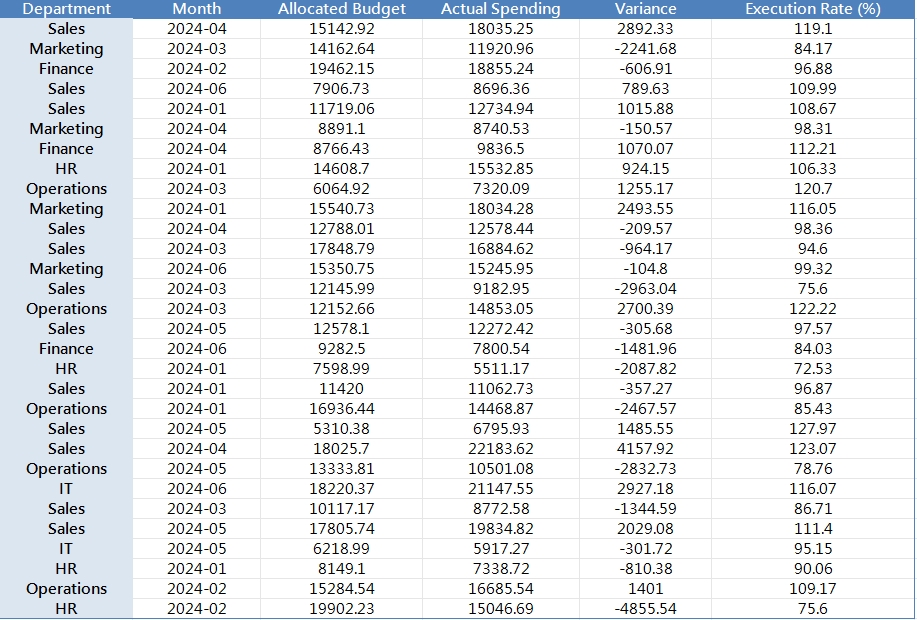
You need to:
- Calculate the variance between budgeted and actual spending
- Identify which departments are consistently over or under budget
- Calculate execution rate (%)
- Compare across months and highlight anomalies
- Create visual charts for department heads
Here's what that looks like in traditional Excel:
Traditional Excel Workflow: Step by Step
Step 1: Clean the data
Often the department names are inconsistent: IT, I.T., Information Tech. Or dates are formatted differently: 2024/01, Jan-2024, 2024-01-31. You’ll need to:
- Use
TRIM,PROPER, or evenVLOOKUPto clean department names - Convert dates using
DATEVALUEor custom formatting
Step 2: Calculate variance & execution rate
Now you need to manually write formulas:
= [Actual Spending] - [Allocated Budget]
= [Actual Spending] / [Allocated Budget] * 100
Then drag-fill these for 180 rows. Be careful not to break relative references. If you copy-paste incorrectly, the whole thing falls apart.
Step 3: Build a summary table
Use PIVOT TABLE:
- Rows: Department
- Columns: Month
- Values: Sum of Budget, Sum of Actual, maybe Execution %
Now create calculated fields inside the pivot, or add helper columns. It gets clunky. And don’t forget to refresh every time the data updates.
Step 4: Visualization
Bar charts per department? Line charts for trends? Conditional formatting to flag over-budget months?
You’ll juggle:
IF,ABS,COLOR SCALES- Separate chart sheets
- Manual legend tweaks
All this just to answer: “Which departments are overspending?”
An Example
Imagine HR was allocated $10,000 for February but spent $12,800. You need to:
- Flag this as 28% over budget
- Compare this with last month’s execution rate
- Create a chart showing HR’s spending trend for the year
If you have 6 departments and 6 months, you’re doing this 36 times.
And if a department name was misspelled? Or a new month got added last night? Back to square one.
One-Command Analysis with Excelmatic
I uploaded the same file to Excelmatic and typed this:
“Please calculate the execution rate and variance for each department.”
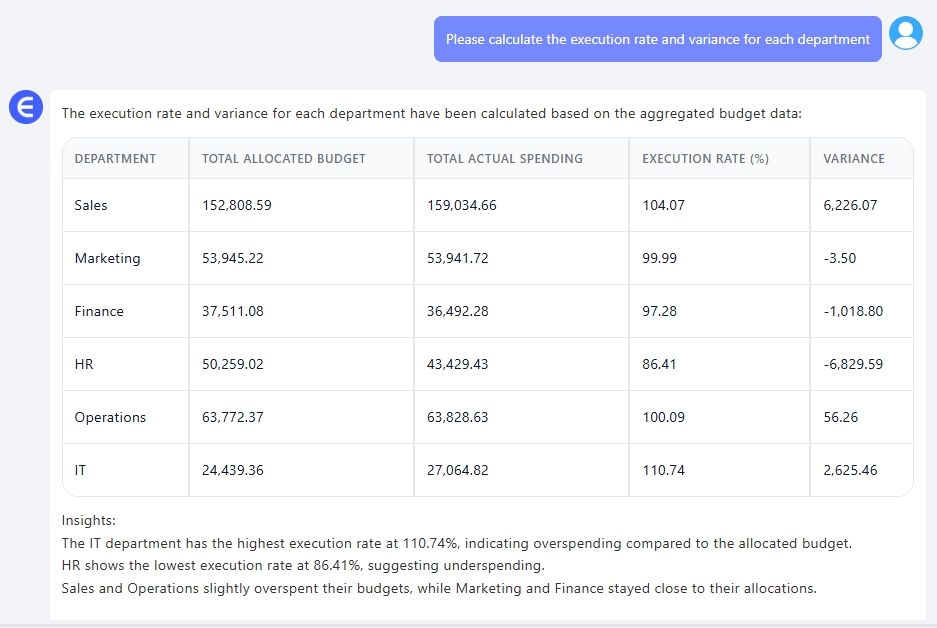
Result? Clean, formatted columns with both metrics, ready to export.
Then I asked:
“Show a dashboard of monthly budget vs. actual by department.”
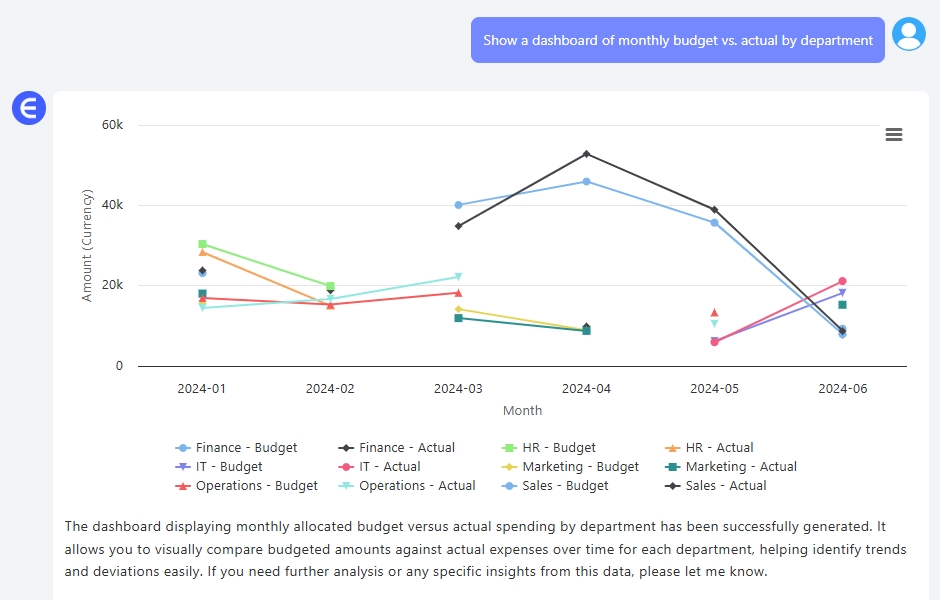
Boom—charts, summary tables, and trend lines across each team. While it doesn’t apply red/yellow highlights like Excel’s conditional formatting, you instantly see which departments are overshooting targets. That’s what matters.
Finally:
“Which departments exceeded their allocated budgets the most times?”
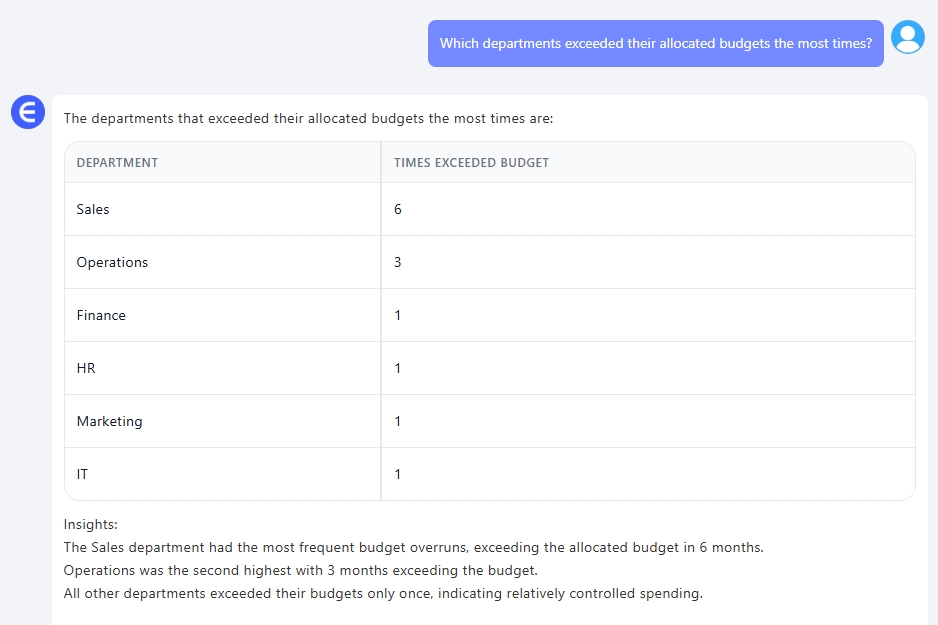
Excelmatic gave me a clean ranked list. No need to manually count or scroll through dozens of rows—I could instantly see who’s blowing their budget more often than not.
Traditional Excel vs Excelmatic
| Task | Traditional Excel | Excelmatic |
|---|---|---|
| Cleaning inconsistent names | Manual VLOOKUP, TRIM, REPLACE |
Auto-cleaned via context awareness |
| Writing formulas | =B2-C2, =C2/B2*100, error-prone copy-paste |
Done automatically |
| Pivot & calculated fields | Complex, fragile, not always visual | Done with a single prompt |
| Trend charts and summaries | Dozens of chart setups, conditional formatting rules | Fully visualized, grouped logically |
| Finding overspenders | Multiple helper columns, filters, and logic | One sentence does it |
Final Thoughts
If you're spending more time managing Excel formulas than actually analyzing your budget data, you're not alone. Most teams are stuck in the same loop. Excelmatic changes that.
Upload a file. Ask in plain English. Get results that you can actually act on.
Want to simplify your budget execution reporting?
Try these prompts in Excelmatic and save yourself hours:Let Excel do the boring work. You focus on the insights.