If you work in finance, operations, or project management, you know the drill:
- List out the planned budget
- Track down actual spending across different reports
- Calculate variance manually
- Highlight overruns and explain them
- Build charts to show trends over time
And the painful part?
- One typo in a formula ruins the entire report
- If actual values update weekly, you have to rebuild everything
- Missing a budget overrun early can cost the team serious money
Result: Hours lost double-checking numbers instead of actually analyzing them.
What Traditional Excel Workflow Looks Like
Let’s say you have this simple project cost tracking table:
| Item | Budget (10K Yuan) | Actual Spending (10K Yuan) |
|---|---|---|
| Salaries | 50 | 55 |
| Operations | 30 | 28 |
| Software | 20 | 20 |
Normal steps in Excel:
- Create a Variance column:
=Actual - Budget - Create a Variance Rate column:
=(Actual - Budget)/Budget - Highlight cells manually if over budget
- Build a bar chart showing variance by item
- Write a paragraph explaining where overspending occurred
Time spent: 1–2 hours (longer if actuals update weekly)
Risk: Easy to miss or miscalculate overruns when dealing with dozens of items.
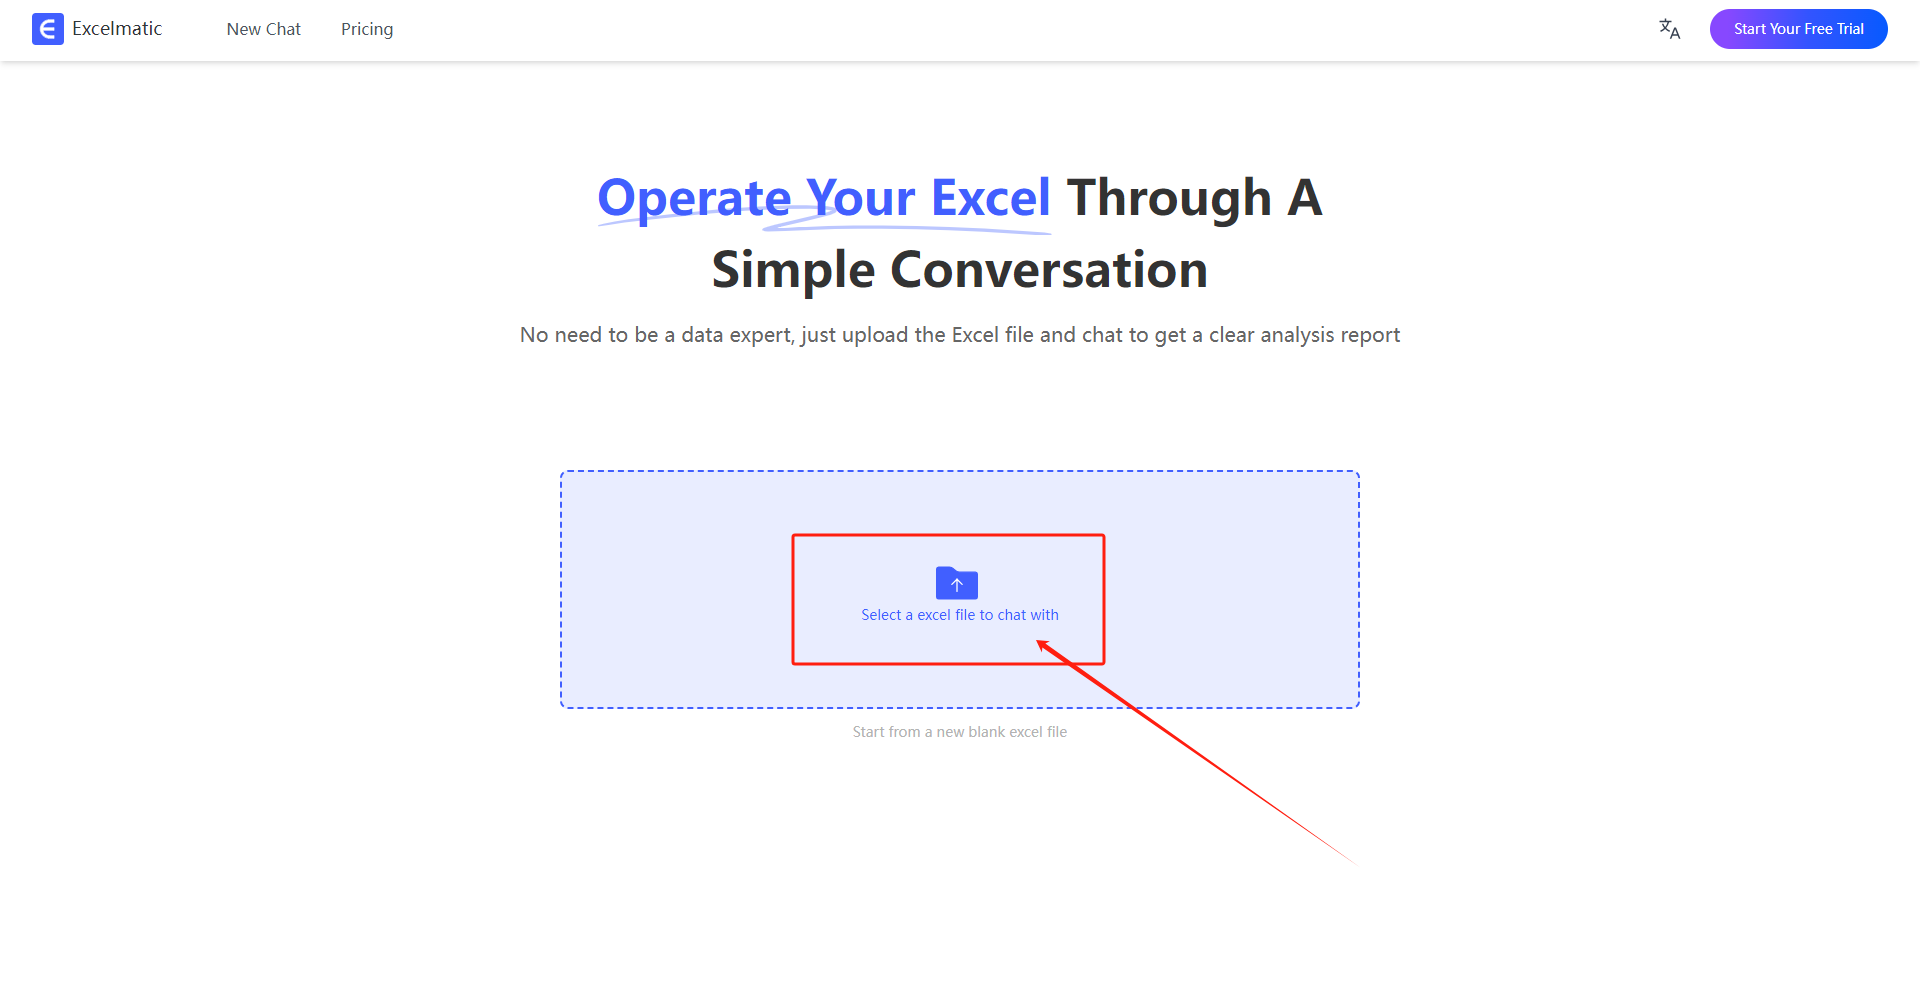
How I Do It Now with Excelmatic
Here’s my upgraded workflow:
- Upload the raw budget vs actual Excel to Excelmatic
- Ask:
"Compare budget and actual spending by item, calculate variance and variance rate. Highlight overspending items and generate visual charts."
What Excelmatic gives me instantly:
- A complete variance table: amount difference and % over/under
- Auto-highlighted overruns
- A clean bar chart showing budget vs actual for each item
- A variance trendline if multiple periods are available
- Optionally, insights like: "Salaries exceeded budget by 10%, main driver of overspending."
Time spent: Less than 2 minutes.
Example Walkthrough: Budget vs Actual Analysis
Input Data:
Prompt to Excelmatic:
"Compare budgeted and actual costs for each item. Show variance, variance rate, and highlight any overruns. Create a bar chart for visual comparison."
Results:
- Bar chart: Budget vs Actual Spending
- Overruns highlighted automatically
- Quick summary insight: "Salaries overspent by 10%; other categories under budget or on target."
Traditional Excel vs Excelmatic
| Feature | Traditional Excel | Excelmatic |
|---|---|---|
| Variance Calculation | Manual formulas and error checking | Automated instantly |
| Updating with New Data | Must manually update formulas | Just re-upload and re-ask |
| Chart Creation | Manual bar charts and formatting | Auto-generated clean visuals |
| Highlighting Overruns | Manual conditional formatting | Automatic detection and highlighting |
| Time to Finish | 1–2 hours per report | Under 2 minutes |
Why I Prefer Excelmatic for Budget Tracking
- Efficiency: 10x faster reporting
- Accuracy: No manual math mistakes
- Automation: Data updates? Re-run analysis in seconds
- Visualization: Instant, clean charts ready for reports
- Scalability: Handles 3 items or 300 items just as easily
Final Thoughts: Make Finance Smarter, Not Harder
Finance work shouldn’t mean living inside SUMIFS formulas and stressing over variance checks.
Now I let Excelmatic handle the boring (and critical) parts:
- Catching overspending early
- Summarizing variances cleanly
- Freeing up my time to actually recommend solutions, not just crunch numbers
If you’re tired of manually tracking budget vs actuals, trust me — it’s time for a smarter way.
Try Excelmatic for your next finance report. Your spreadsheet (and your sanity) will thank you.