If you've ever had to pull together monthly or quarterly finance reports across departments, you know the pain:
- Merging income and expenses from multiple sheets
- Building SUMIFS or VLOOKUP formulas to match the right data
- Double-checking calculations to make sure nothing went wrong
- Fixing weird formatting and missing rows
- Spending hours just to get a clean summary
And even after all that, you still had to:
- Create separate charts manually
- Check if totals matched
- Explain discrepancies when mistakes popped up
Result: One word — exhaustion.
What Traditional Excel Work Looked Like
Let’s say you had sales and marketing data like this:
| Department | Month | Revenue (10K Yuan) | Expense (10K Yuan) |
|---|---|---|---|
| Sales | Jan | 120 | 80 |
| Sales | Feb | 150 | 100 |
| Marketing | Jan | 80 | 60 |
| Marketing | Feb | 90 | 70 |
Normal steps:
- Copy-paste each sheet into one file
- Use
SUMIFS()to summarize revenue and expenses by department - Build a profit column:
=Revenue - Expense - Create pivot tables to show departmental totals
- Build bar charts manually for revenue, expense, and profit
- Check for missing data or misaligned months
Time spent: Easily 2–3 hours, especially for big datasets.
How I Do It Now with Excelmatic
Now my process looks like this:
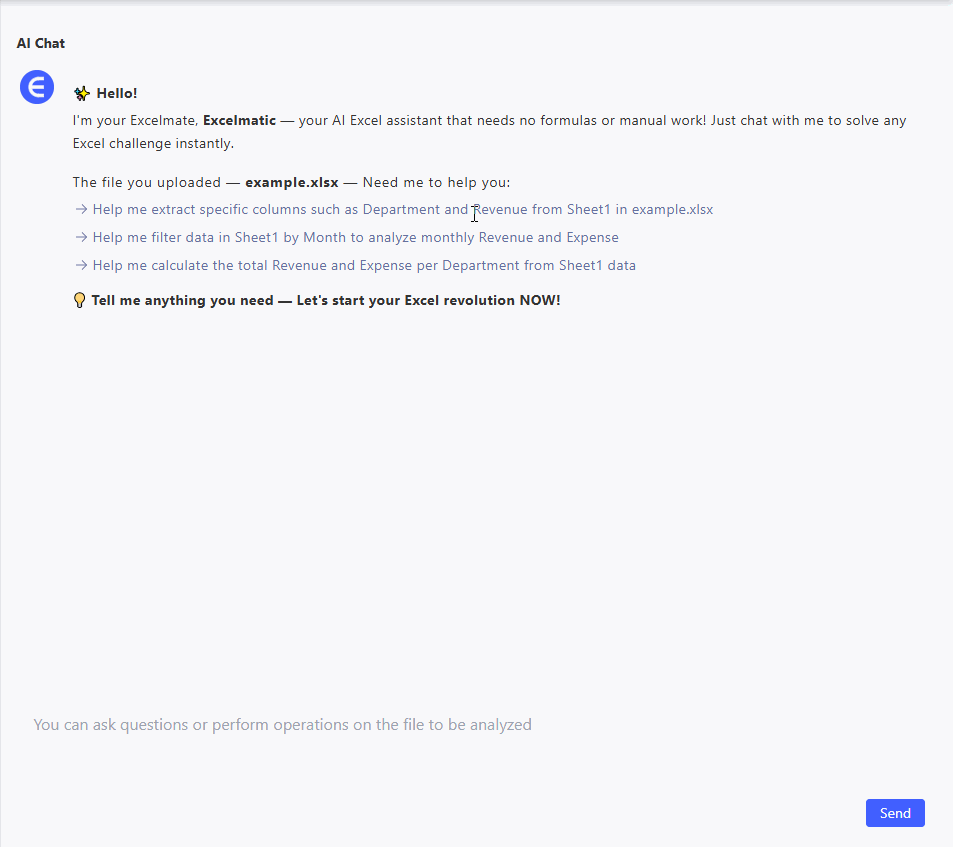
- Upload the raw department data to Excelmatic
- Ask:
"Summarize 2024 Q1 revenue, expenses, and profit by department. Generate charts."
✅ What Excelmatic gives me:
- Total revenue, total expense, and profit by department
- A clean, color-coded summary table
- A bar chart comparing each department’s revenue vs expenses
- A profit highlight chart (showing which department was most profitable)
- Automated consistency checks (missing month? It tells me.)
Time spent: Less than 2 minutes
Example: Sales & Marketing Finance Summary
Input data:
Prompt to Excelmatic:
"Summarize by department total revenue, total expenses, and calculate profit. Create comparison charts."
Excelmatic output:
- Bar chart: Revenue vs Expense per department
- Profit bar: Highlights which team delivered more surplus
Traditional Excel vs Excelmatic — Clear Comparison
| Dimension | Traditional Excel | Excelmatic |
|---|---|---|
| Data merging | Manual copy, align, formula check | Auto-merge upon upload |
| Formula building | SUMIFS, VLOOKUP, manual calculations | Natural language queries |
| Report generation | Pivot tables + manual chart setup | Instant summary tables + charts |
| Time to finish | 2–3 hours | Under 2 minutes |
| Visual outputs | Manual design needed | Clean, ready-to-use charts provided |
Why Excelmatic Changed How I Work
- Speed: Saves me hours per month
- Accuracy: No more cell reference nightmares
- Automation: One prompt gets full results
- Visualization: Charts are built automatically, no need for formatting wars
- Scalability: Even if I have 10 departments and 12 months, it still works in seconds
Final Thoughts: Why Work Harder When You Can Work Smarter?
Old me:
- Spend Saturday nights tweaking SUMIFS formulas
- Stress about wrong totals before a Monday meeting
New me with Excelmatic:
- Upload → Ask → Export results in minutes
- Focus on real financial insights, not on fixing broken spreadsheets
If you’re still manually building finance reports the old-fashioned way, seriously — it’s time to upgrade.
Try Excelmatic today. Your weekends will thank you.