Managing sales performance is essential for any business, but analyzing sales data, comparing actual vs target goals, and creating meaningful reports can take time and effort—especially when you’re dealing with large amounts of product data.
In this post, I’ll show you how to use Excelmatic, a smart Excel tool, to streamline your sales tracking. With just three simple questions, you’ll compare actual sales with target goals, generate visual reports, and calculate key metrics like revenue-to-sales ratios—no formulas needed.
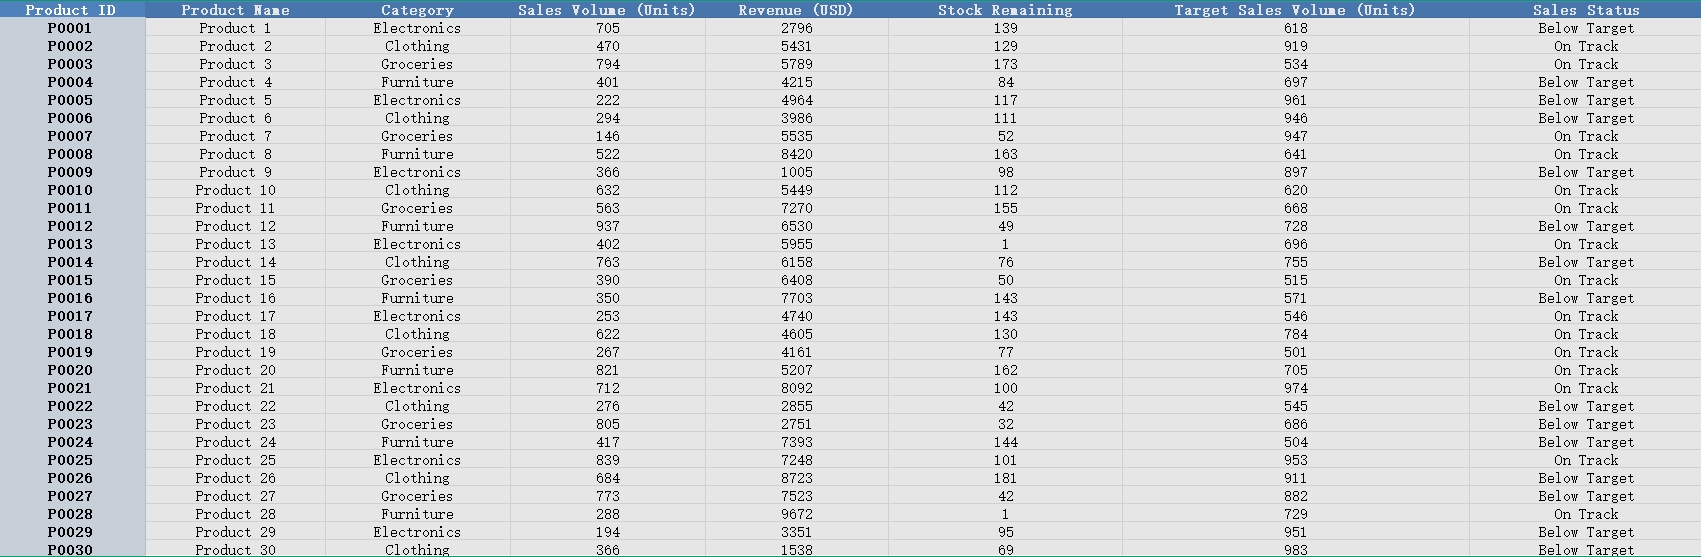
The Dataset: Product Sales Data
Here’s the dataset that we’ll be working with:
✅ Excelmatic in Action: 3 Prompts for Product Performance
1️⃣ Compare Actual Sales vs Target
Prompt: Please calculate the sales performance (Actual vs Target) for each product.
💡 Result: Excelmatic calculates the sales performance as follows:
Now you can instantly spot which products are on track to meet their sales targets and which are falling short.
2️⃣ Visualize Sales Volume vs Target for Each Product
Prompt: Please generate a bar chart comparing sales volume vs target for each product.
💡 Result: Excelmatic generates a clean bar chart, which helps you easily visualize how well each product is performing:
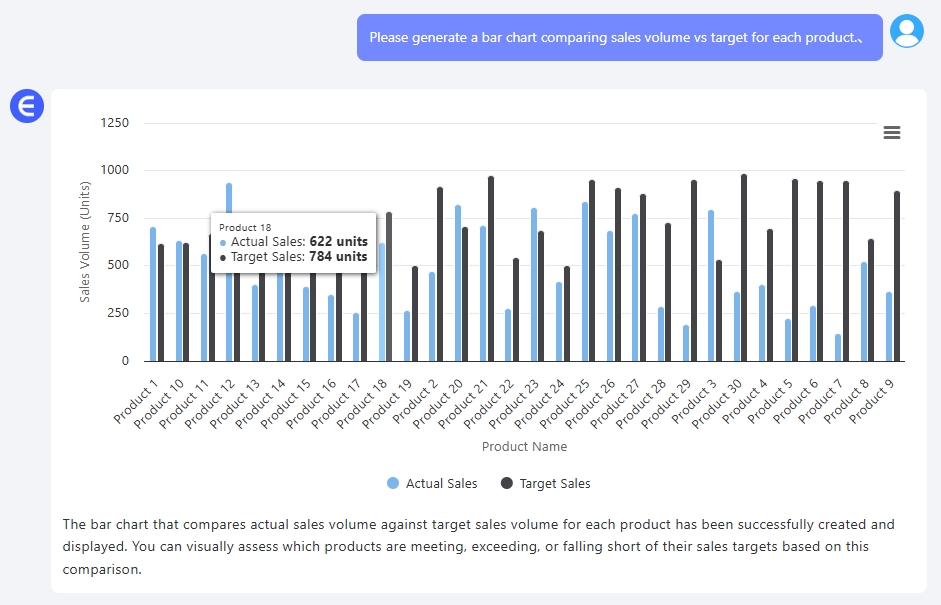
- Compare actual sales volume against target goals for each product category.
- Spot products that need more attention or promotion.
3️⃣ Calculate Revenue to Sales Ratio for Each Product
Prompt: Please calculate the revenue to sales ratio for each product.
💡 Result: Excelmatic calculates the revenue-to-sales ratio for each product:
This metric is valuable for understanding how well each product is generating revenue relative to the units sold.
What You Can Do With These Results
- Identify underperforming products: Quickly spot which products need more marketing or adjustments to their sales strategy.
- Create performance dashboards: Use the bar chart and performance tables to create easy-to-read dashboards for your team or executives.
- Optimize inventory and stock levels: By comparing actual sales with targets, you can adjust inventory levels to match demand.
- Measure profitability: With the revenue-to-sales ratio, you can identify high-performing products with the best return on sales.
Final Thoughts
Tracking product performance doesn’t need to involve endless formulas and manual calculations. With Excelmatic, you can instantly calculate sales performance, compare targets, and visualize key data points with just a few simple prompts.
No formulas, no pivot tables—just insights that matter.
Upload your file and start analyzing sales data like a pro: Try Excelmatic Now >>