In any business, keeping track of inventory is crucial to avoid overstocking or stockouts. The more efficiently you manage your stock levels, the smoother your operations will run. But managing inventory in Excel can be tricky—especially if you need to identify products that need restocking or generate alerts for low inventory.
With Excelmatic, setting up an inventory warning system is as simple as asking three questions. You don’t need to write complex formulas or use pivot tables; just ask Excelmatic, and it will give you clear, actionable insights.
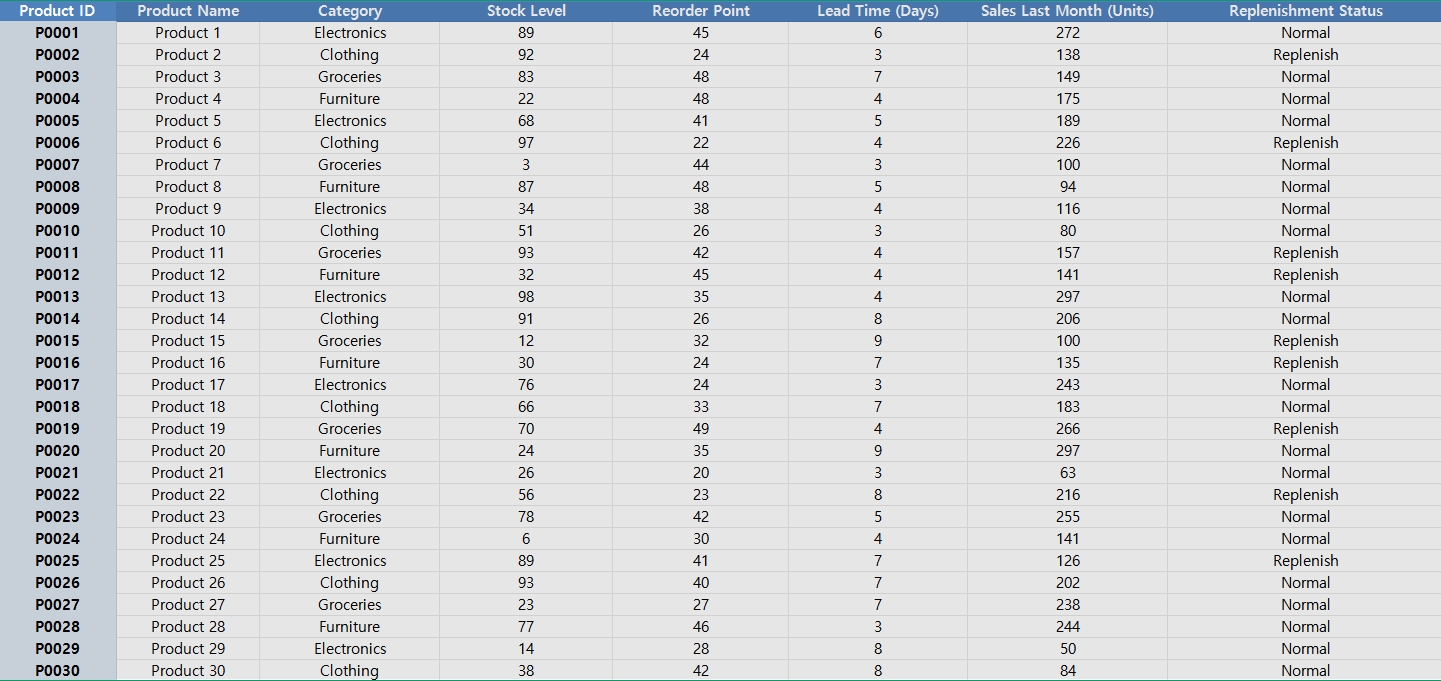
The Scenario: Inventory Data Sheet
Here's an example of what your product inventory data might look like:
✅ Excelmatic in Action: 3 Prompts to Manage Inventory
1️⃣ Calculate Stock Shortage
Prompt: Please calculate the stock shortage for each product (Stock Level vs Reorder Point).
💡 Result: Excelmatic compares the stock level to the reorder point and highlights products that are below the threshold:
These products need to be restocked soon.
2️⃣ Visualize Stock vs Reorder Point
Prompt: Please create a bar chart comparing current stock vs reorder point for each product
💡 Result:
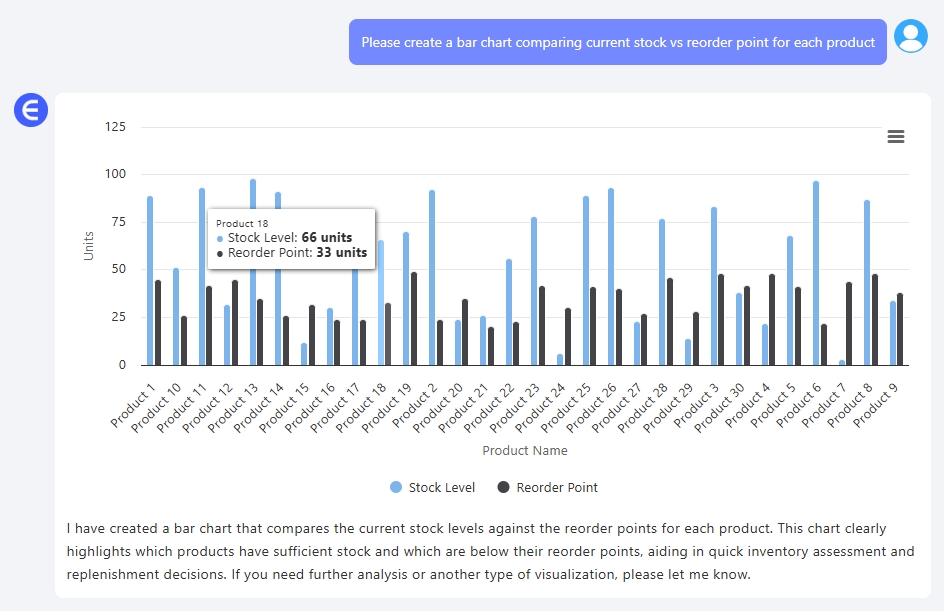
Excelmatic generates a clean bar chart comparing stock levels with reorder points, helping you visualize where you’re at risk of running out of stock. It’s a quick way to identify products that need immediate replenishment.
3️⃣ Calculate Days of Sales Remaining
Prompt: Please calculate the days of sales remaining based on current stock level and sales last month.
💡 Result: Excelmatic computes how many days of sales you have left based on the current stock and sales performance:
You can see which products are at risk of running out soon and plan for replenishment.
What You Can Do With These Results
- Track inventory levels: Get alerts when stock is low or near the reorder point.
- Visualize stock vs target: Quickly spot products that need restocking.
- Forecast sales remaining: Make smarter purchasing decisions based on actual sales data.
- Optimize inventory management: Avoid overstocking or stockouts by analyzing sales trends and stock levels.
Final Thoughts
Managing your inventory doesn’t have to be a complicated or time-consuming task. By simply asking Excelmatic three questions, you can automatically calculate stock shortages, visualize inventory levels, and forecast sales remaining. No formulas. No pivot tables.
Now you have a simple, actionable view of your inventory, and you can make data-driven decisions.
Want to optimize your inventory tracking?Try Excelmatic now >>