Tracking public budgets isn’t just about recording numbers—it’s about seeing where money goes, how efficiently it’s used, and where problems arise.
But let’s be honest: building budget dashboards in Excel usually means fighting with formulas like SUMIFS, IFERROR, and conditional formatting for hours.
In this post, I’ll show you how to skip all of that using Excelmatic, and monitor your budget performance with three natural language prompts. We'll compare actual vs planned budgets, track spending over quarters, and assess how well departments utilize their allocations.
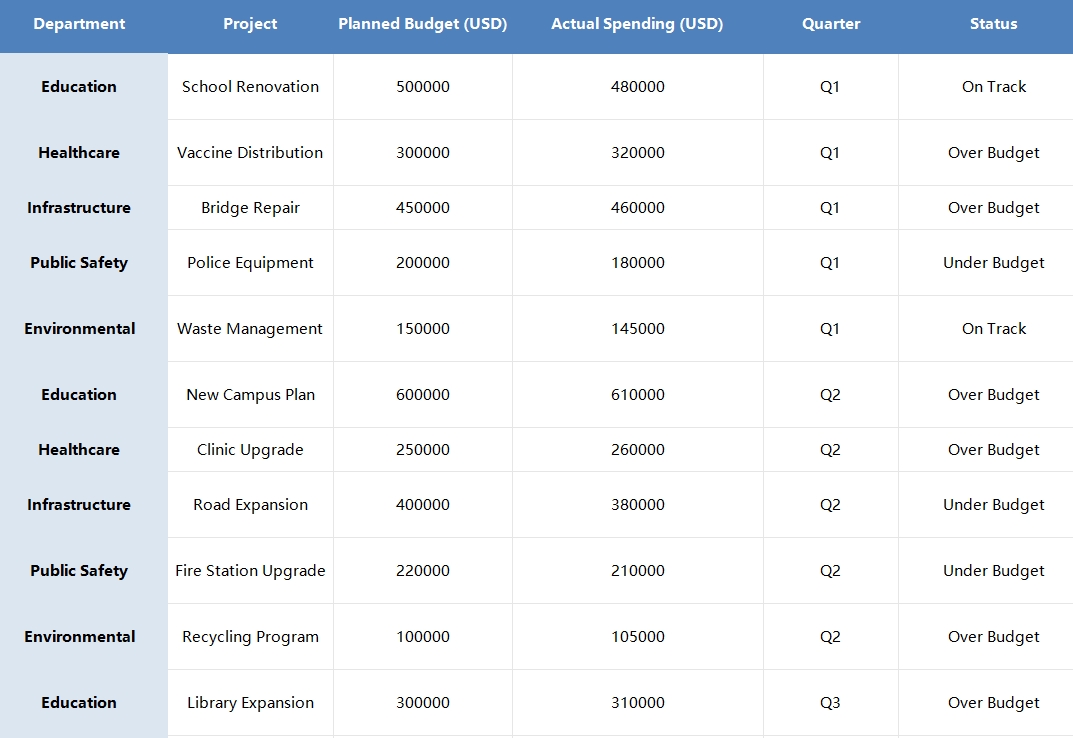
The Scenario: A Multi-Department Public Budget Sheet
Here’s the kind of data you might manage:
What I Asked Excelmatic (And What I Got)
1️⃣ Compare Planned vs Actual by Project
Prompt: Please generate a bar chart comparing planned and actual budget by project.
Result: Excelmatic instantly created a side-by-side bar chart for each project. You can visually spot over- or under-spending at a glance:
- Vaccine Distribution and Bridge Repair overshot the budget.
- School Renovation came in just under.
- Great for presentations or quick health-checks.
2️⃣ View Budget Use by Quarter
Prompt: Please group by quarter and show total planned vs actual spending.
Result:
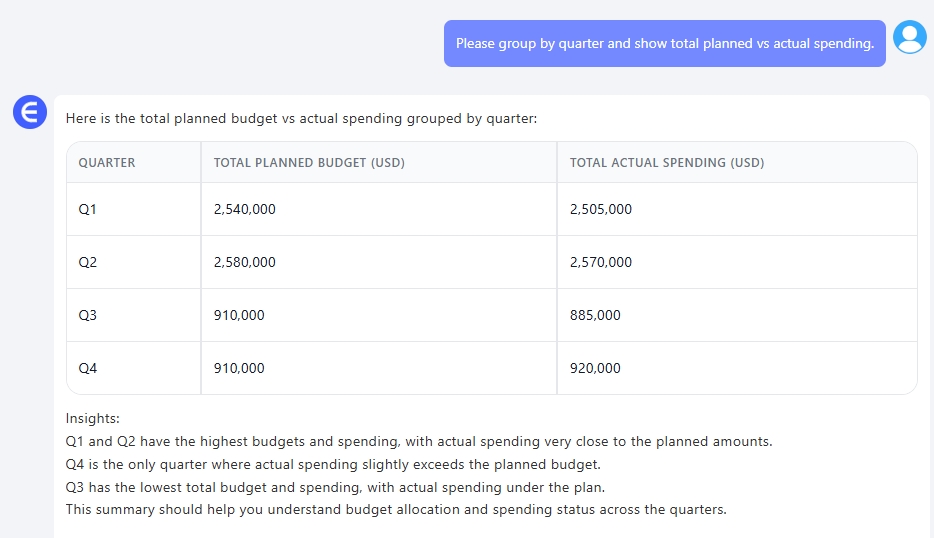
A clean, summarized breakdown—perfect for quarterly reporting, variance tracking, and cross-period comparison.
3️⃣ Department-Level Budget Utilization
Prompt (in Chinese): Please calculate the average budget utilization rate by department.
Result:
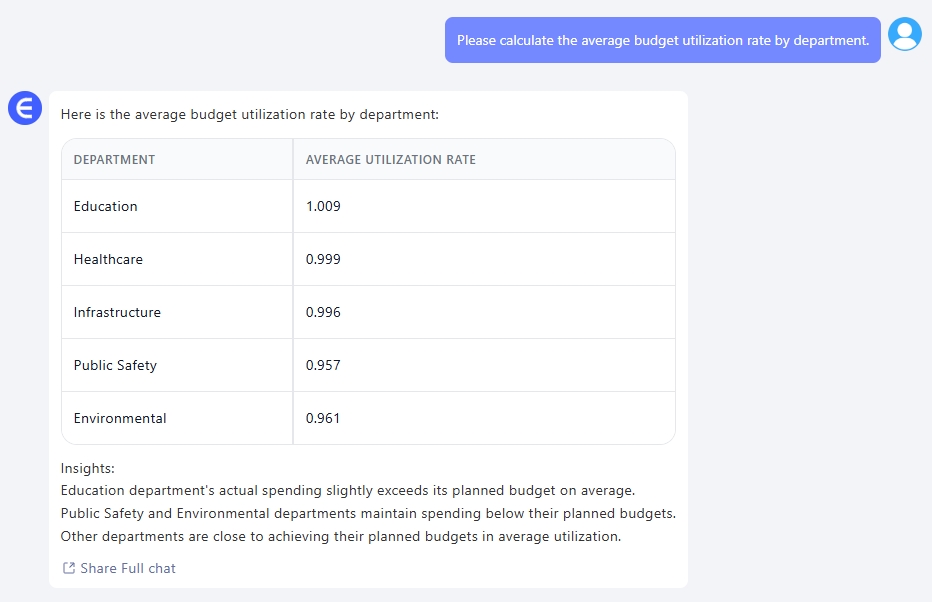
Now you know who’s overspending—and who might be underutilizing resources.
What You Can Do With These Results
- Build public spending dashboards without touching formulas
- Identify departments consistently over/under budget
- Spot project-level inefficiencies early
- Impress leadership with automated, visual financial insights
Final Thoughts
You don't need complex Excel formulas to manage complex financial data. With just three prompts, I turned a flat budget sheet into:
- A bar chart comparing planned vs actual spending
- A quarterly spending summary
- A department utilization analysis
Fast, visual, and accurate—with zero functions involved.
Want to try it on your government, nonprofit, or enterprise budget data?Try Excelmatic now >>