Inventory management is the lifeline of e-commerce businesses—excess inventory ties up capital, while stockouts directly lead to customer loss. Traditional Excel methods require manual data integration and calculation of reorder quantities, which are both time-consuming and prone to errors. This article will demonstrate how Excelmatic's AI capabilities can transform inventory optimization from daily manual labor to real-time automated management, with practical data demonstration tables included.
The Key Importance of Real-Time Inventory Optimization
Preventing Stockout Losses
- Amazon research shows: 30% of customers will turn to competitors when encountering stockouts.
- Impact: Directly leads to revenue loss and long-term damage to customer relationships.
Reducing Holding Costs
- Capital Lockup: Excess inventory ties up working capital.
- Storage Costs: Can consume up to 25% of total profits.
- Obsolescence Risk: Especially critical for fashion/electronics.
Improving Turnover Efficiency
- Best Practice: Rational restocking can increase inventory turnover by over 50%.
- Operational Advantage: Faster cash conversion cycle.
Traditional Excel vs. Excelmatic: In-Depth Inventory Optimization Comparison
Traditional Excel Workflow (Detailed Steps)
Step 1: Data Integration
Export raw data from multiple systems:
Sales_Report_2024Q3.csv(SKU, sales amount, date)Current_Stock.csv(SKU, inventory)Lead_Time.csv(SKU, supplier lead time)
Manually merge data using VLOOKUP:
=VLOOKUP(A2, Lead_Time!A:B, 2, FALSE)  // Match lead time
=VLOOKUP(A2, Current_Stock!A:B, 2, FALSE)  // Match inventory
Need to manually handle
#N/Amismatch errors.
Example Data Table:
| SKU | Product | 30-day Sales | Current Inventory | Lead Time (days) |
|---|---|---|---|---|
| SKU-ELC-101 | Wireless Headphones | 450 | 120 | 14 |
| SKU-WTCH-202 | Smartwatch | 320 | 80 | 21 |
Step 2: Reorder Calculation
- Daily Sales Volume:
=C2/30 - Safety Stock:
=ROUNDUP(E2*D2*1.2, 0) - Reorder Quantity:
=MAX(ROUNDUP(D2*(E2+7)-B2,0),0)
Formula Output:
| SKU | Daily Sales Volume | Safety Stock | Reorder Quantity |
|---|---|---|---|
| SKU-ELC-101 | 15 | 252 | 267 |
| SKU-WTCH-202 | 11 | 277 | 254 |
Step 3: Risk Analysis
Conditional Formatting to Mark Stockout Risks:
=IF(B2<Safety Stock*0.5,"Critical",IF(B2<Safety Stock,"Watch","Normal"))Manually filter slow-moving items (sales < 10% of inventory)
Send report to procurement team via email
Excelmatic Solution
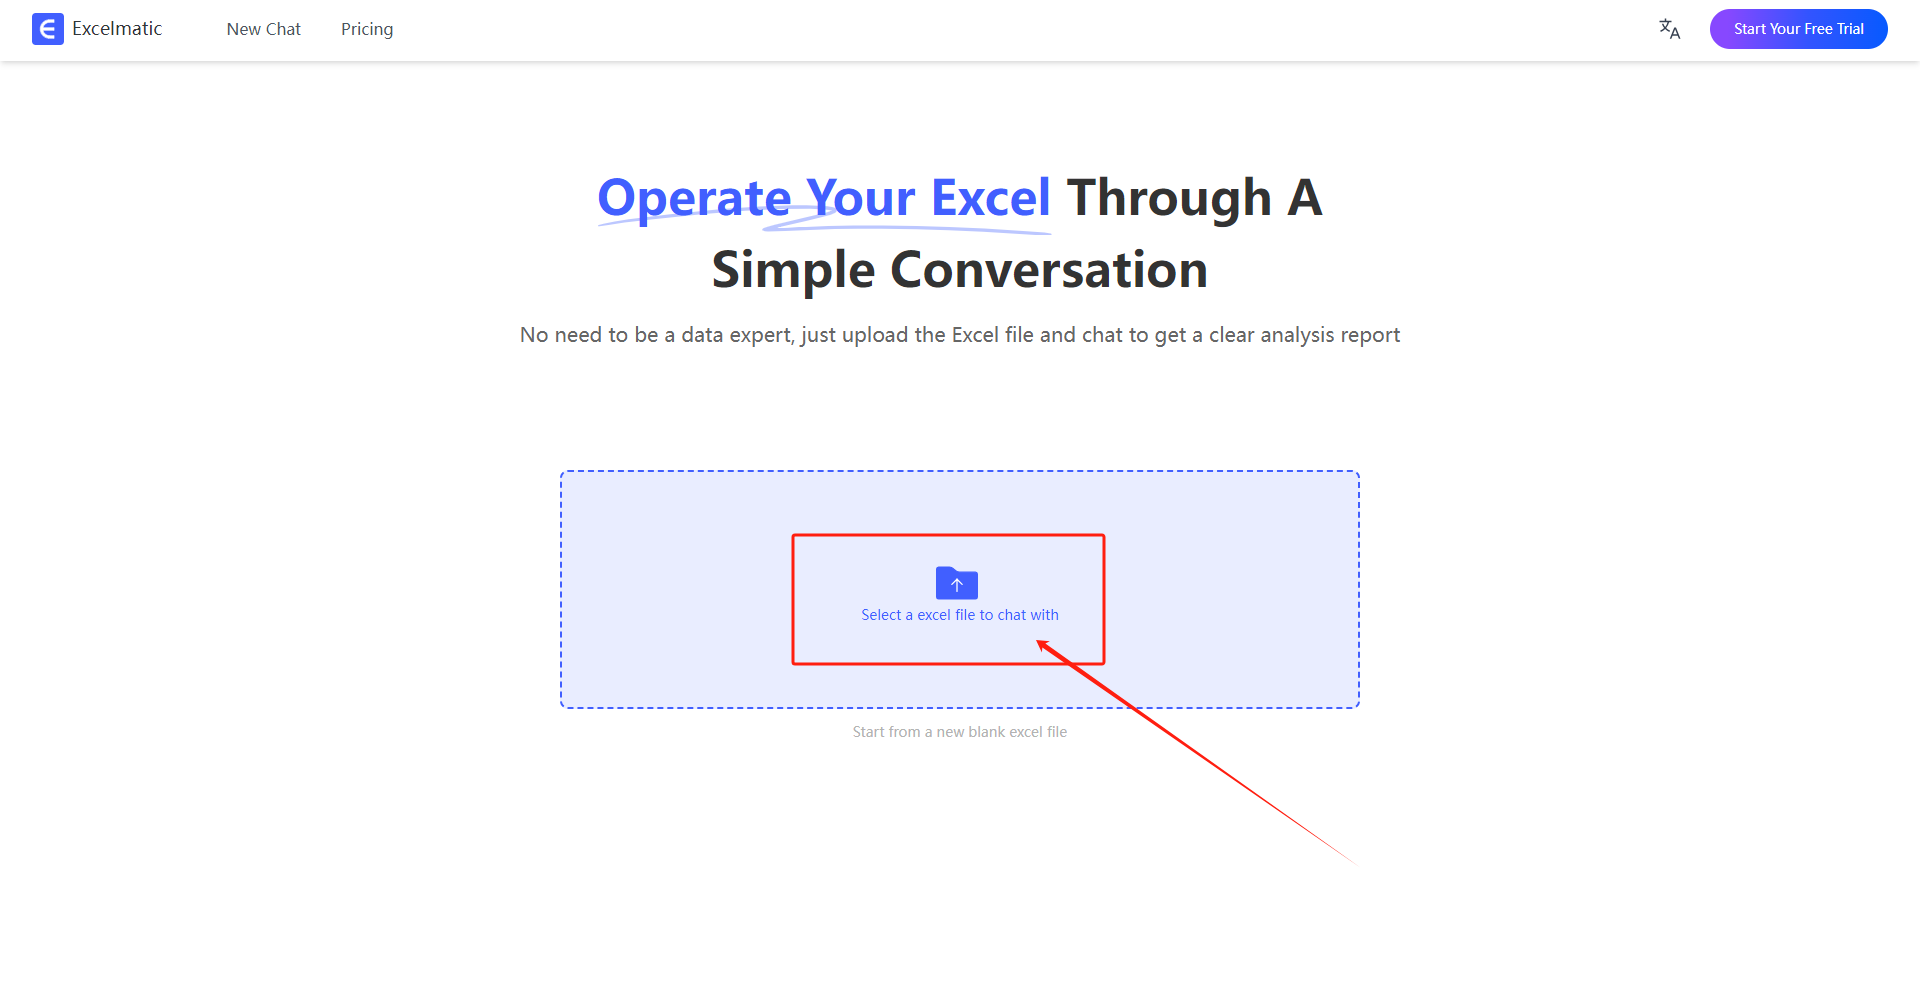
Step 1: Upload Data
Step 2: Enter Natural Language Instructions
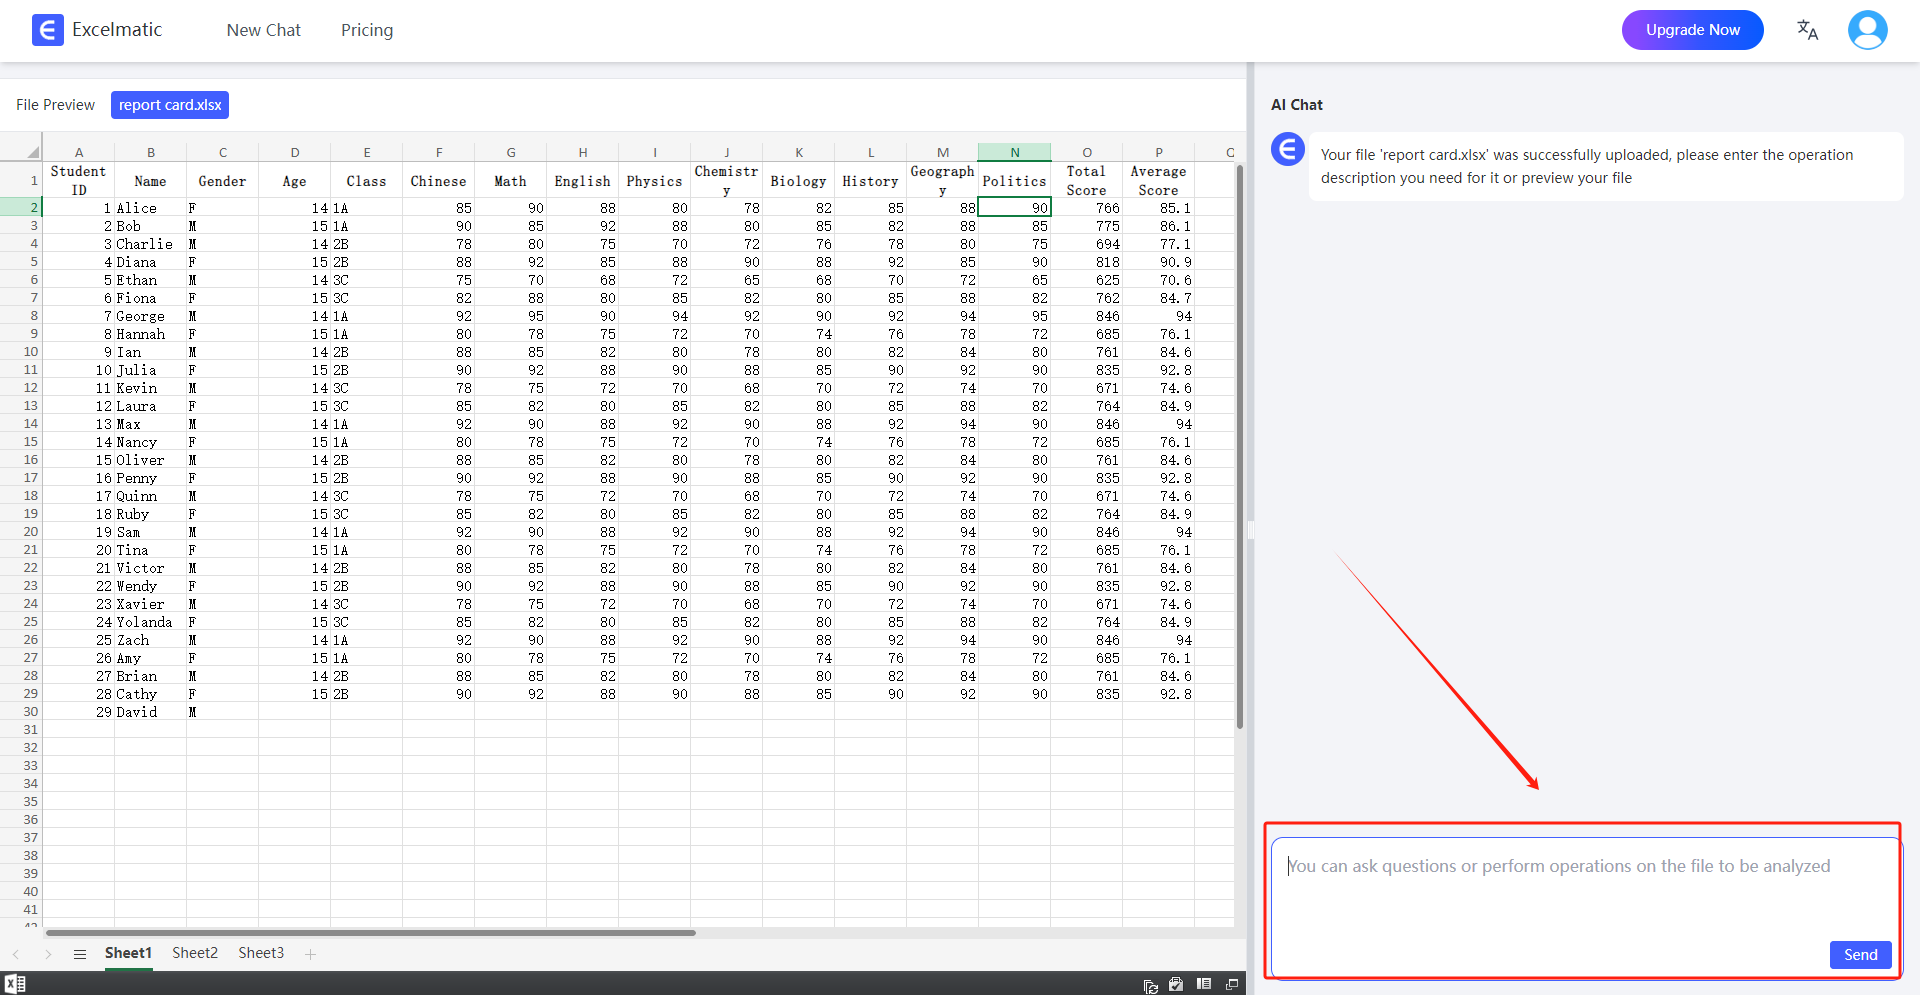
Enter in the Excelmatic dialog box:
Optimize inventory based on the following rules:
- Calculate daily average demand based on the past 30-day sales.
- Safety Stock = Daily Average Sales × Lead Time × 1.2.
- Mark high-risk items with inventory below 50% of safety stock.
- List slow-moving items with 30-day sales less than 10% of inventory.
Step 3: Result Output
Workflow Comparison
| Tool | Traditional Excel | Excelmatic |
|---|---|---|
| Data Preparation | Manually clean CSV, delete invalid columns | Directly upload raw files, AI automatically cleans data |
| Rule Setting | Write complex formulas: | Describe business rules in natural language: |
=ROUNDUP((B2/30)*D2*1.2,0) |
“Safety Stock = Daily Average Sales × Lead Time × 1.2” | |
| Risk Identification | Manual screening: =IF(C2<E2*0.5,"High Risk","") |
Excelmatic automatically marks and grades risks, with additional solutions |
| Time Consumption | 4 hours (data + formulas + communication) | 8 minutes (upload + instruction + confirmation) |
Why Choose Excelmatic?
✅ Zero Learning Cost: No need to memorize formulas, describe needs in everyday language
✅ Deep Business Fit: AI understands industry terms (such as Safety Stock Turnover Rate)
✅ Decision Acceleration: From data to action in less than 10 minutes