How to Monitor and Optimize Your Recruitment Pipeline with Excel Analysis

Tracking candidates from application to offer is easy in theory—but hard in practice. If you’ve ever been stuck cleaning up messy Excel rows, calculating interview gaps, or counting who’s still "in progress," you know how tedious recruitment reporting can be.

In this post, I’ll show you how to monitor and optimize your hiring pipeline using just three smart questions with Excelmatic. No formulas. No macros. Just useful answers, fast.


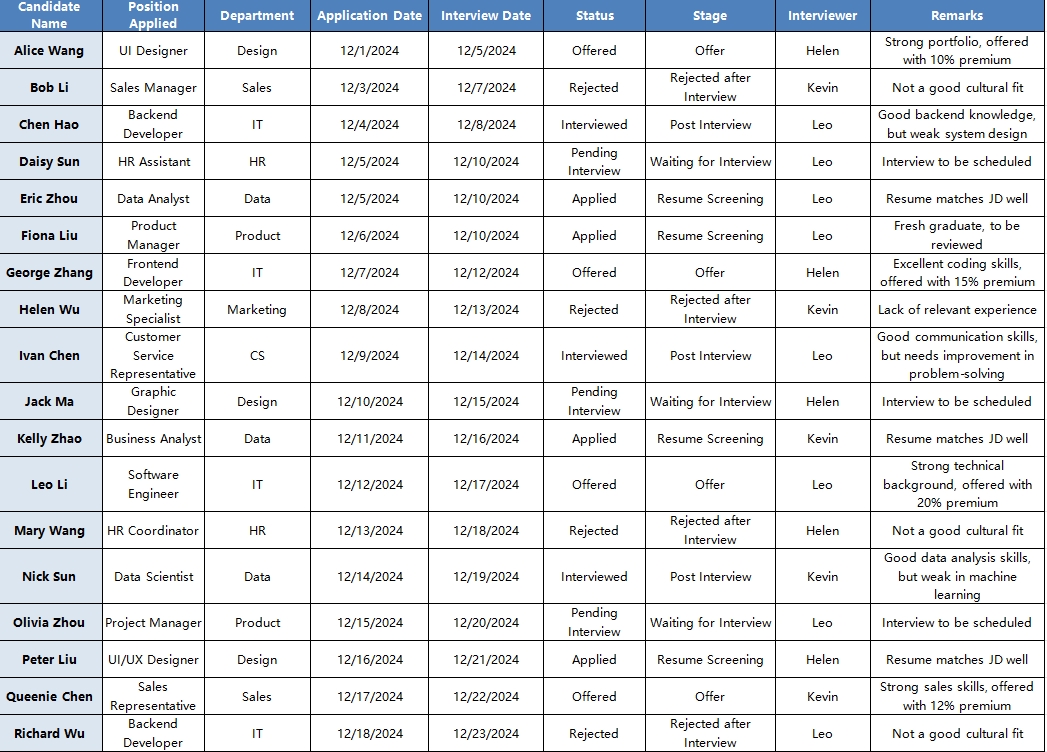
The Scenario: A Simple Recruitment Tracker

Here’s a typical HR tracker. You’ve got:

depart

Now, your manager wants to know:

  • How many candidates are at each stage?
  • How long does it take to schedule interviews?
  • Who’s been handling the most interviews?

The Traditional Way: Filters, Pivots, and a Lot of Time

You could:

  • Build a pivot table to count statuses
  • Use DATEDIF() or NETWORKDAYS() to compute delays
  • Filter by interviewer and manually tally interviews

This works, but it’s slow, repetitive, and hard to scale.


The Excelmatic Way: Ask 3 Questions, Get 3 Insights

1️⃣ Candidate Stage Overview

Prompt: “Please summarize the number of candidates by status (Applied, Interviewed, Offered, Rejected).”

💡 Result: You get a clean summary table like this:

depart

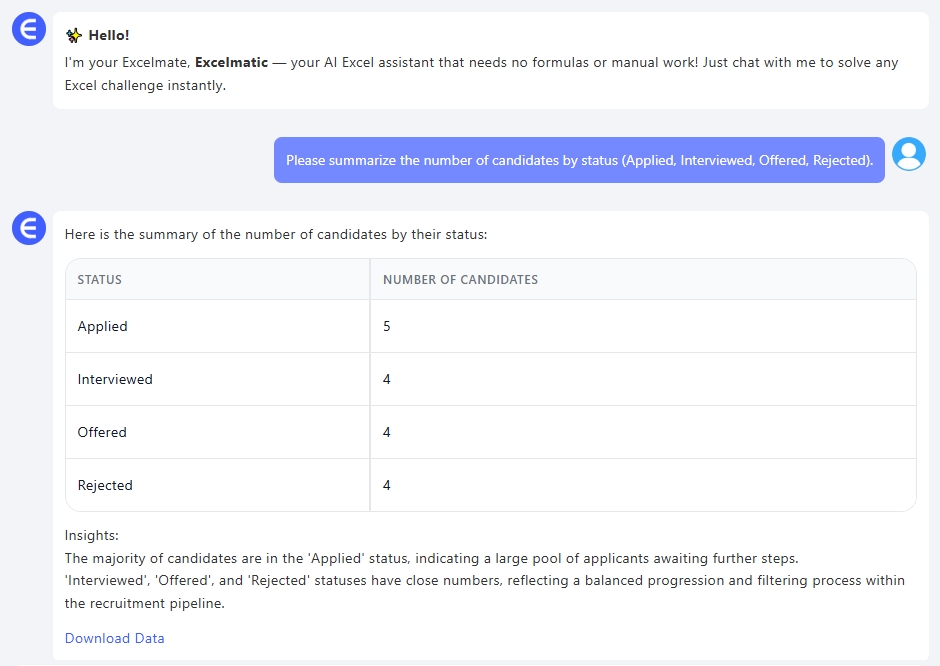
Perfect for building a funnel view or dashboard chart.


2️⃣ Time-to-Interview Efficiency

Prompt: “Please calculate the number of days between application and interview for each candidate.”

💡 Result: Excelmatic automatically calculates lead time:

depart

Now you know how quickly your team is moving from resume to conversation—and which roles are lagging.


3️⃣ Interviewer Workload

Prompt: “Please show which interviewer handled the most interviews.”

💡 Result: Simple summary:

depart

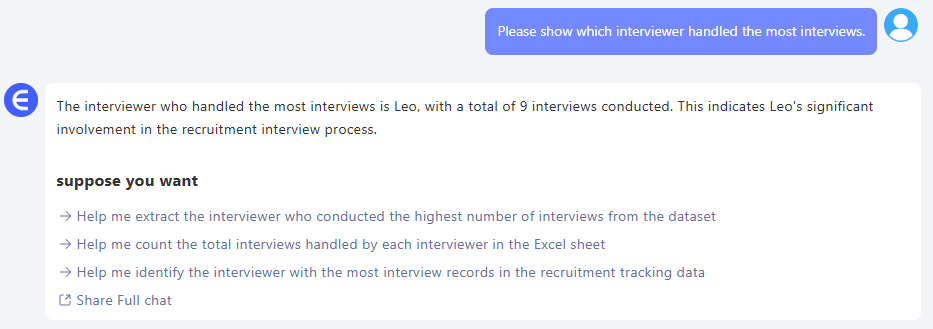
From here, you can visualize interviewer load, or rotate tasks if needed.


What You Can Do with This Data

  • Build a recruitment funnel chart showing drop-off rates
  • Track average time to interview by department or position
  • Identify delays or bottlenecks in scheduling
  • Balance interviewer assignments more fairly

All this without writing a single formula.


Final Thoughts

With just three questions, Excelmatic helped us:

  • Visualize our recruitment pipeline
  • Measure hiring speed
  • Understand team workload

It’s not about replacing Excel—it’s about making Excel smarter. And for hiring teams dealing with dozens of candidates across roles, speed and clarity matter.

Click here to see the full prompt flow and try the tool >>

Want to try Excelmatic with your own recruitment tracker?Try Excelmatic Now >>

Ditch Complex Formulas – Get Insights Instantly

No VBA or function memorization needed. Tell Excelmatic what you need in plain English, and let AI handle data processing, analysis, and chart creation

Try Excelmatic Free Now

Recommended Posts

How to Perform a Breakeven Analysis with Excel AI
Excel Tips

How to Perform a Breakeven Analysis with Excel AI

Discover how AI is revolutionizing financial planning with Excelmatic. Learn to perform break-even analysis in Excel using traditional methods and Excelmatic's AI-powered tools. Simplify your financial planning with instant calculations and intuitive visualizations. Read more to see how Excelmatic can transform your business!

Sally
How to Analyze Campaign ROI and Performance with Excel AI Tools
Excel Tips

How to Analyze Campaign ROI and Performance with Excel AI Tools

Discover how to use Excel AI tools to review campaign ROI, trends, and performance. Find your top 5 campaigns, chart ROI over time, and calculate cost efficiency—no formulas needed.

Sally
How to Set Up an Inventory Warning System in Excel and Track Replenishment Needs
Excel Tips

How to Set Up an Inventory Warning System in Excel and Track Replenishment Needs

Track your inventory levels, flag products needing replenishment, and forecast sales remaining with simple prompts using Excelmatic—no formulas required.

Sally
How to Analyze Daily Sales Data and Track Targets Using Excel
Excel Tips

How to Analyze Daily Sales Data and Track Targets Using Excel

Use Excel to track daily sales, visualize performance vs target, and identify underperforming days. No formulas required.

Sally
How to Analyze KPI Achievement Rates Across Departments Using Excel AI
Excel Tips

How to Analyze KPI Achievement Rates Across Departments Using Excel AI

Track KPI achievement rates across departments using Excelmatic. Visualize performance and detect gaps with three easy prompts—no pivot tables required.

Sally
How to Compare Sales vs Target and Visualize Product Performance in Excel
Excel Tips

How to Compare Sales vs Target and Visualize Product Performance in Excel

Compare actual vs target sales and visualize product performance in Excel using Excelmatic. Generate charts, calculate revenue ratios, and identify sales gaps easily.

Sally