If you're a data analyst still buried in CSVs, manual charts, and late-night formula debugging, it's time to upgrade your toolbox.
In 2025, being a great analyst isn’t about writing more =IF() formulas. It’s about delivering insights—faster, clearer, and with less chaos. The rise of AI-enhanced tools means we no longer need to waste time on repeatable tasks like cleaning messy data, hunting down outliers, or redoing the same chart twenty times just because the date range changed.
Here’s a deep dive into the top tools every data analyst should know right now. These aren’t buzzword-heavy “AI superplatforms”—they’re practical, battle-tested tools that actually help you get your job done. Each one connects to your data, lightens your mental load, and most importantly—makes you look good.
1. Excelmatic
Data cleaning, analysis, and charts—just ask.
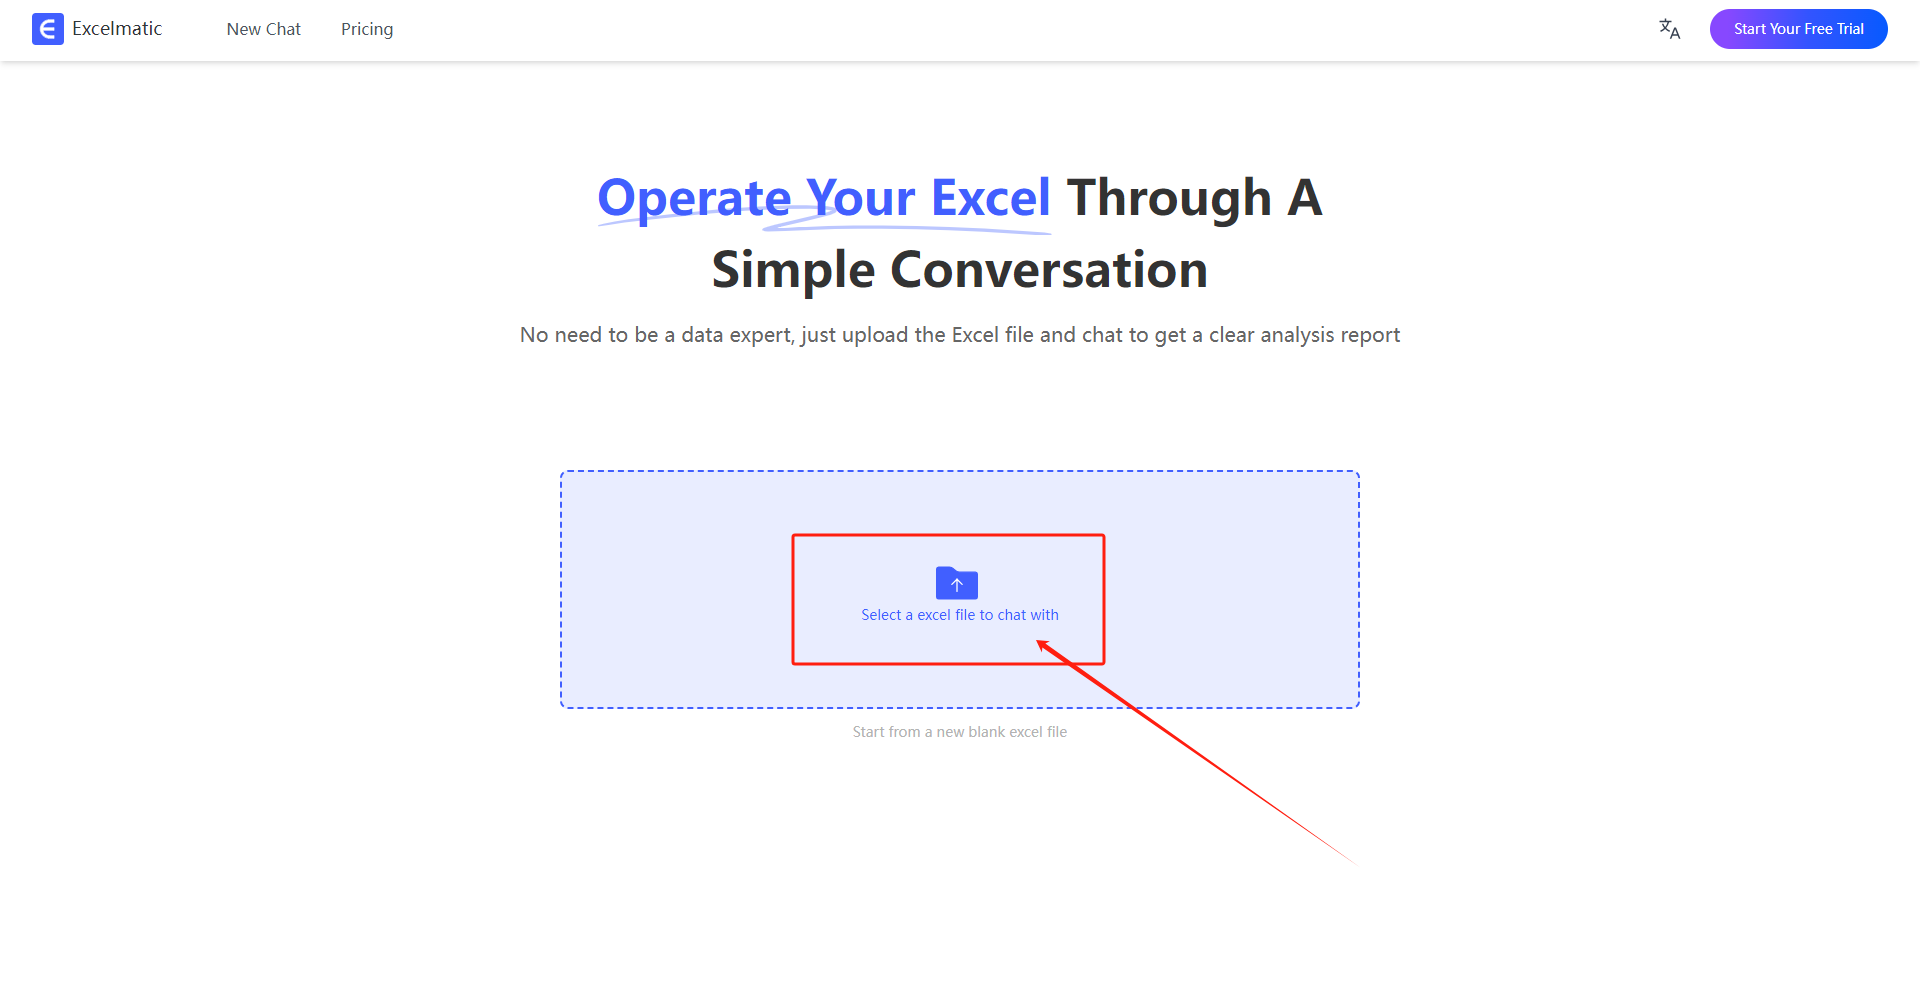
If you’re spending more time writing formulas than exploring insights, Excelmatic is your new favorite tool.
Upload any messy spreadsheet—raw survey results, weekly KPIs, customer transactions, website logs—and start asking questions like:
“Group by campaign and calculate average CTR.”
“Flag outliers in revenue growth by region.”
“Build a trend chart for sessions and bounce rate over time.”
Excelmatic transforms your spreadsheet into a smart analysis engine. It cleans messy columns, detects missing values, transforms formats, runs descriptive stats, and creates charts on the fly—all based on simple English questions.
For data analysts, it’s the fastest way to explore hypotheses, validate patterns, and build quick summaries for reports—without building the report from scratch.
Pricing: Free trial, starting at just $5.99/month
Best For: Data analysts who want to explore Excel datasets faster, cleaner, and with more flexibility—no code required.
2. MonkeyLearn
Text data, meet machine learning—minus the PhD
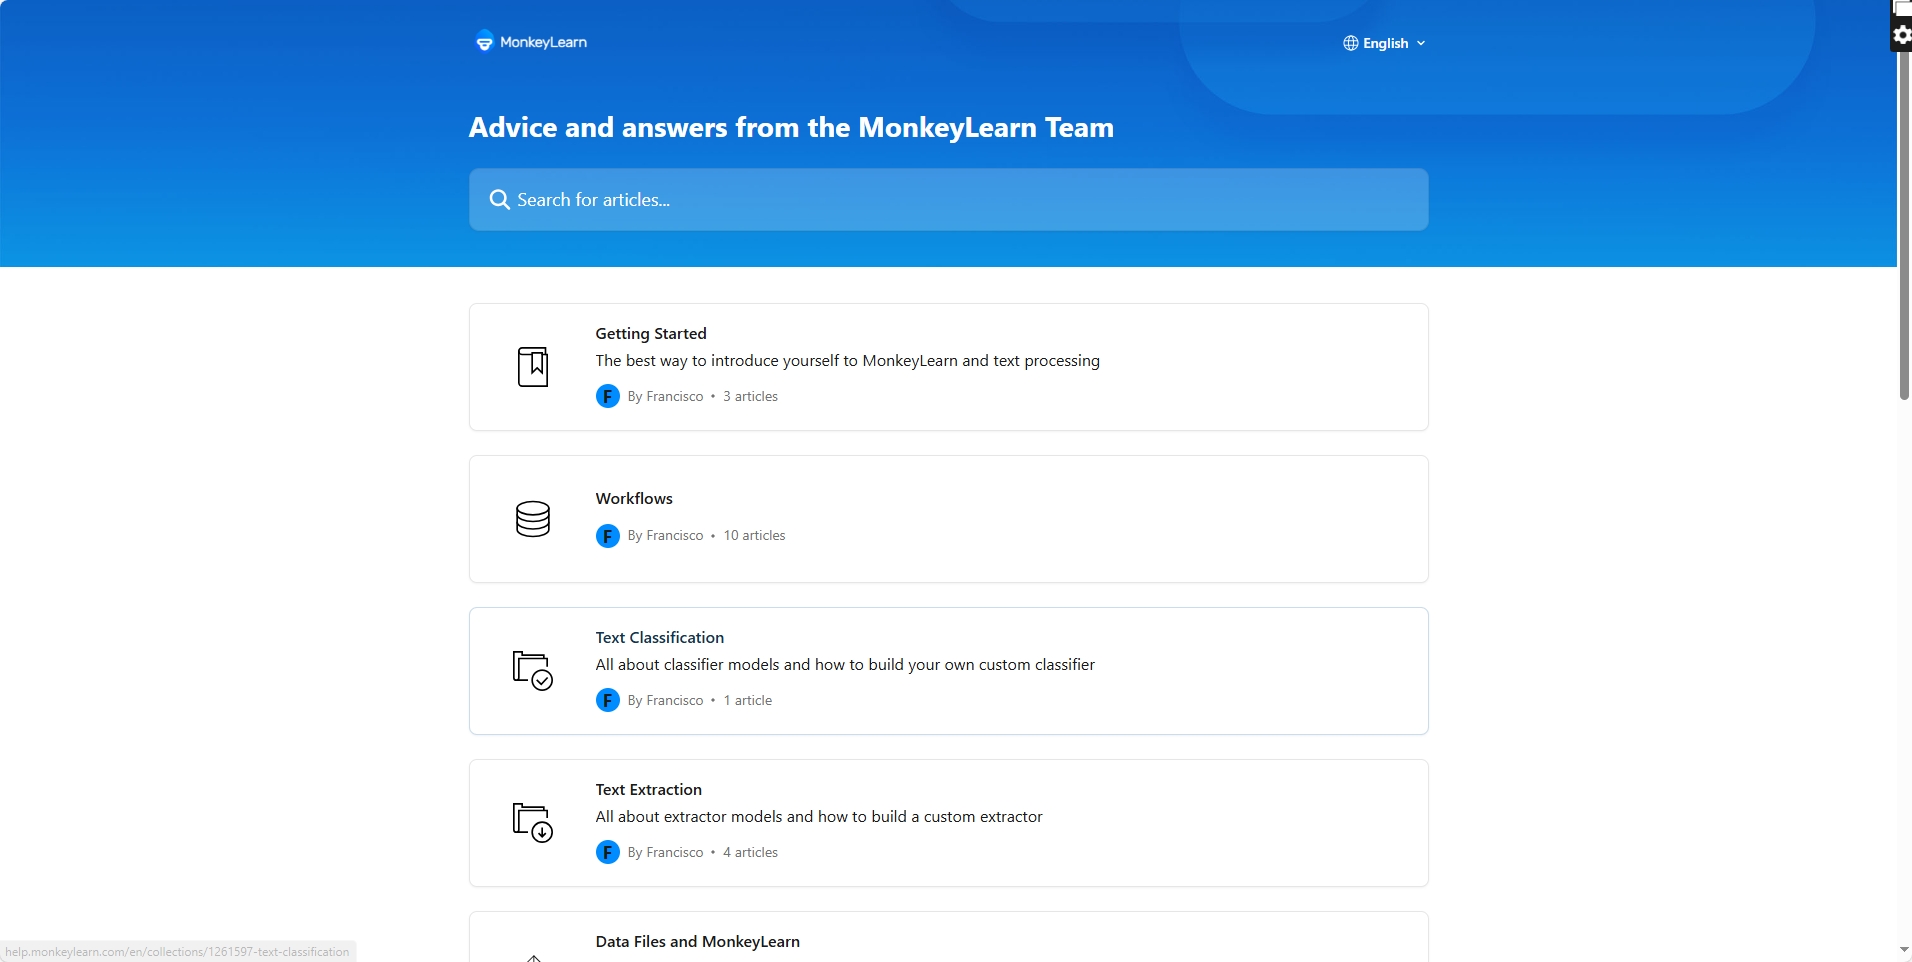
Data isn't always numeric. If you're analyzing customer reviews, support tickets, or survey responses, MonkeyLearn makes text analysis stupidly simple.
You can train it to extract keywords, classify sentiment, or group comments by topic. The drag-and-drop UI makes building models surprisingly fun, and their Google Sheets plugin turns unstructured feedback into dashboards in minutes.
Pair it with Excelmatic and you have a full pipeline: clean the data with one, analyze emotion and intent with the other.
Pricing: Free up to 300 queries/month, then from ~$299/month
Best For: Analysts dealing with unstructured or qualitative data
3. Power BI
When your spreadsheet becomes a system
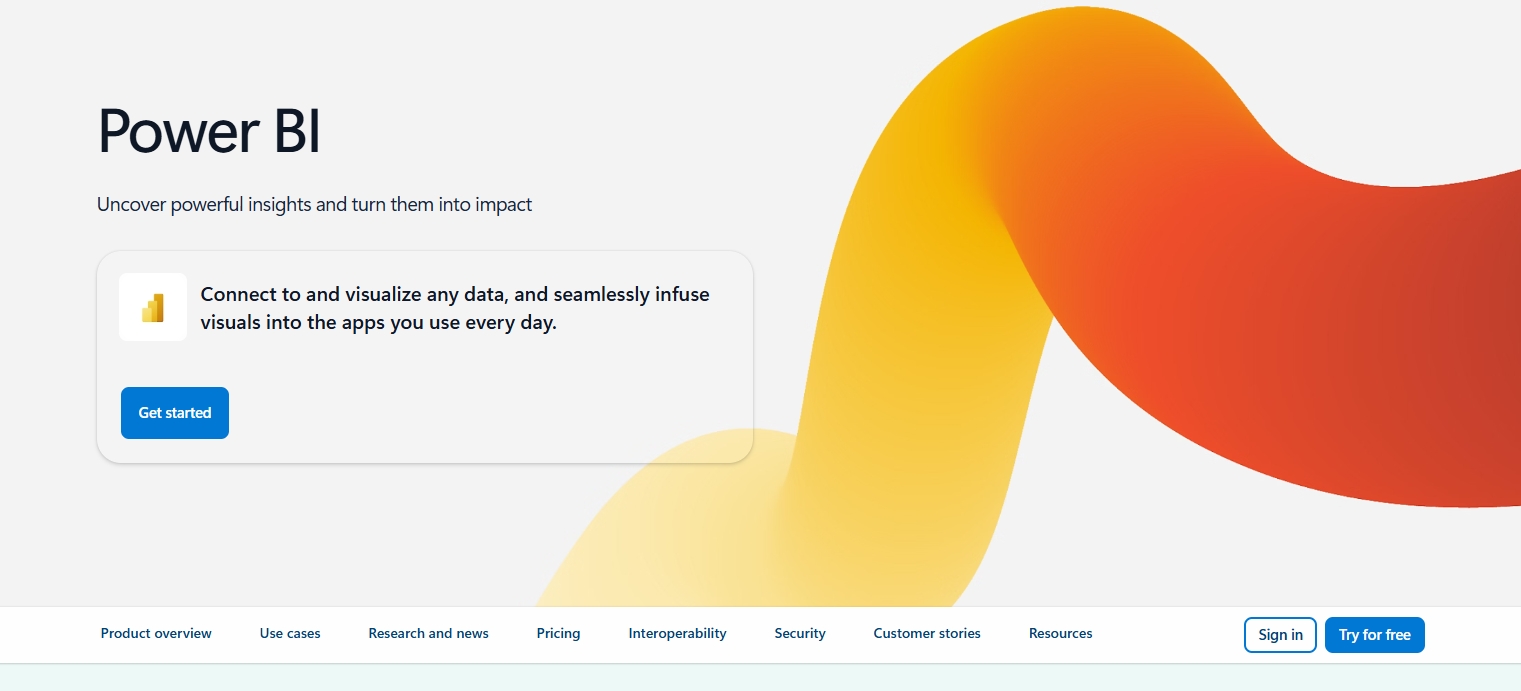
If your reporting lives in Excel but your boss wants dashboards, Power BI is your gateway drug into full-fledged data storytelling. It connects to nearly anything (SQL, APIs, Excel, Salesforce), has drag-and-drop charting, and offers layered filtering for stakeholders who want to slice and dice on demand.
Power BI isn't just about visuals—it’s also where your cleaned, filtered data goes to shine. Use Excelmatic to prepare, then drop the results into Power BI for dynamic delivery.
Pricing: Free Desktop version, Pro starts at ~$10/month/user
Best For: Analysts presenting recurring data to execs, clients, or the broader org
4. Tableau
For when you need jaw-dropping dashboards
Yes, Tableau and Power BI are rivals. Tableau wins on design polish and visual flexibility. If you're in a company that cares about aesthetics or client-facing analytics, this is your tool.
It shines in exploratory work—you can uncover trends just by dragging and dropping. It’s also fast with large datasets and has amazing community support.
Excelmatic helps clean and prep the dataset. Tableau makes it beautiful.
Pricing: Starts at ~$75/month
Best For: Analysts presenting high-impact insights visually to clients or senior stakeholders
5. Datawrapper
Instant charts, no login, no mess
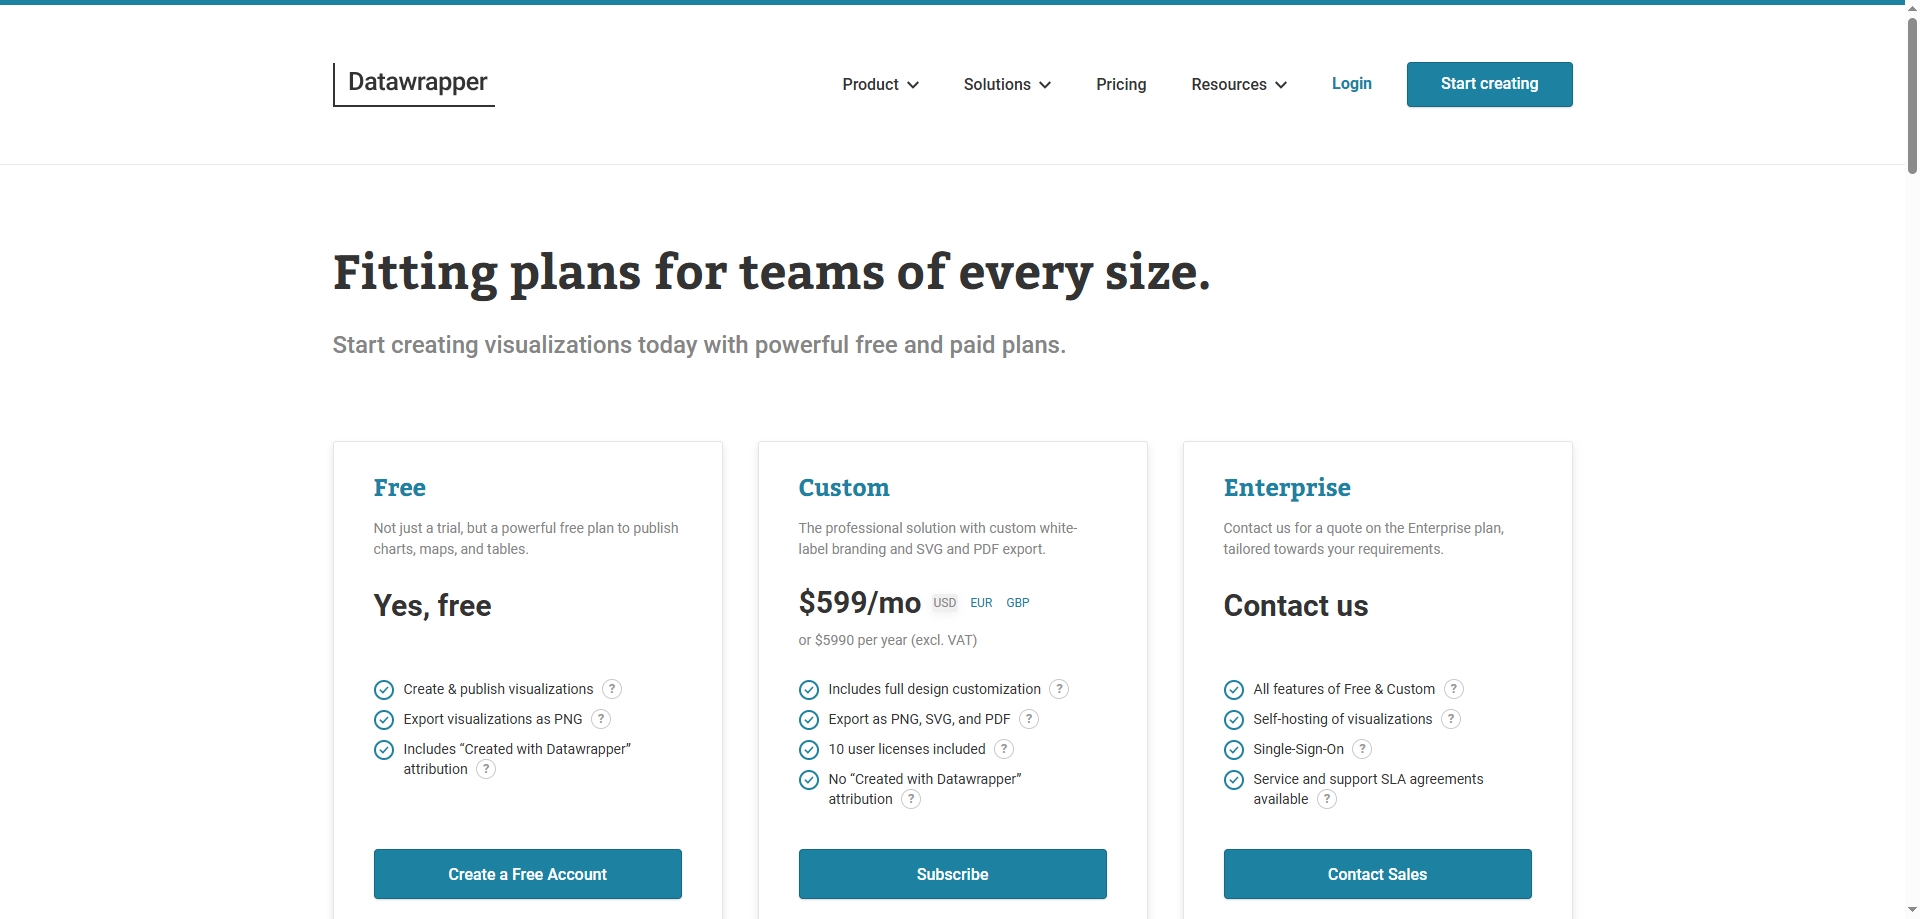
Sometimes you don’t need a dashboard. You just want a clean, responsive chart to drop in a report or blog post. Datawrapper is made for this.
Paste your data, pick your chart style, customize colors, and you're done. Their defaults are gorgeous, and the interface is foolproof.
While Excelmatic and Tableau are great for internal work, Datawrapper is perfect for publishing, pitching, and public-facing content.
Pricing: Free for most chart types; Custom plan from ~$599/year
Best For: Data analysts who need fast, publication-quality charts
6. Coefficient
Connect spreadsheets to real-time data without APIs
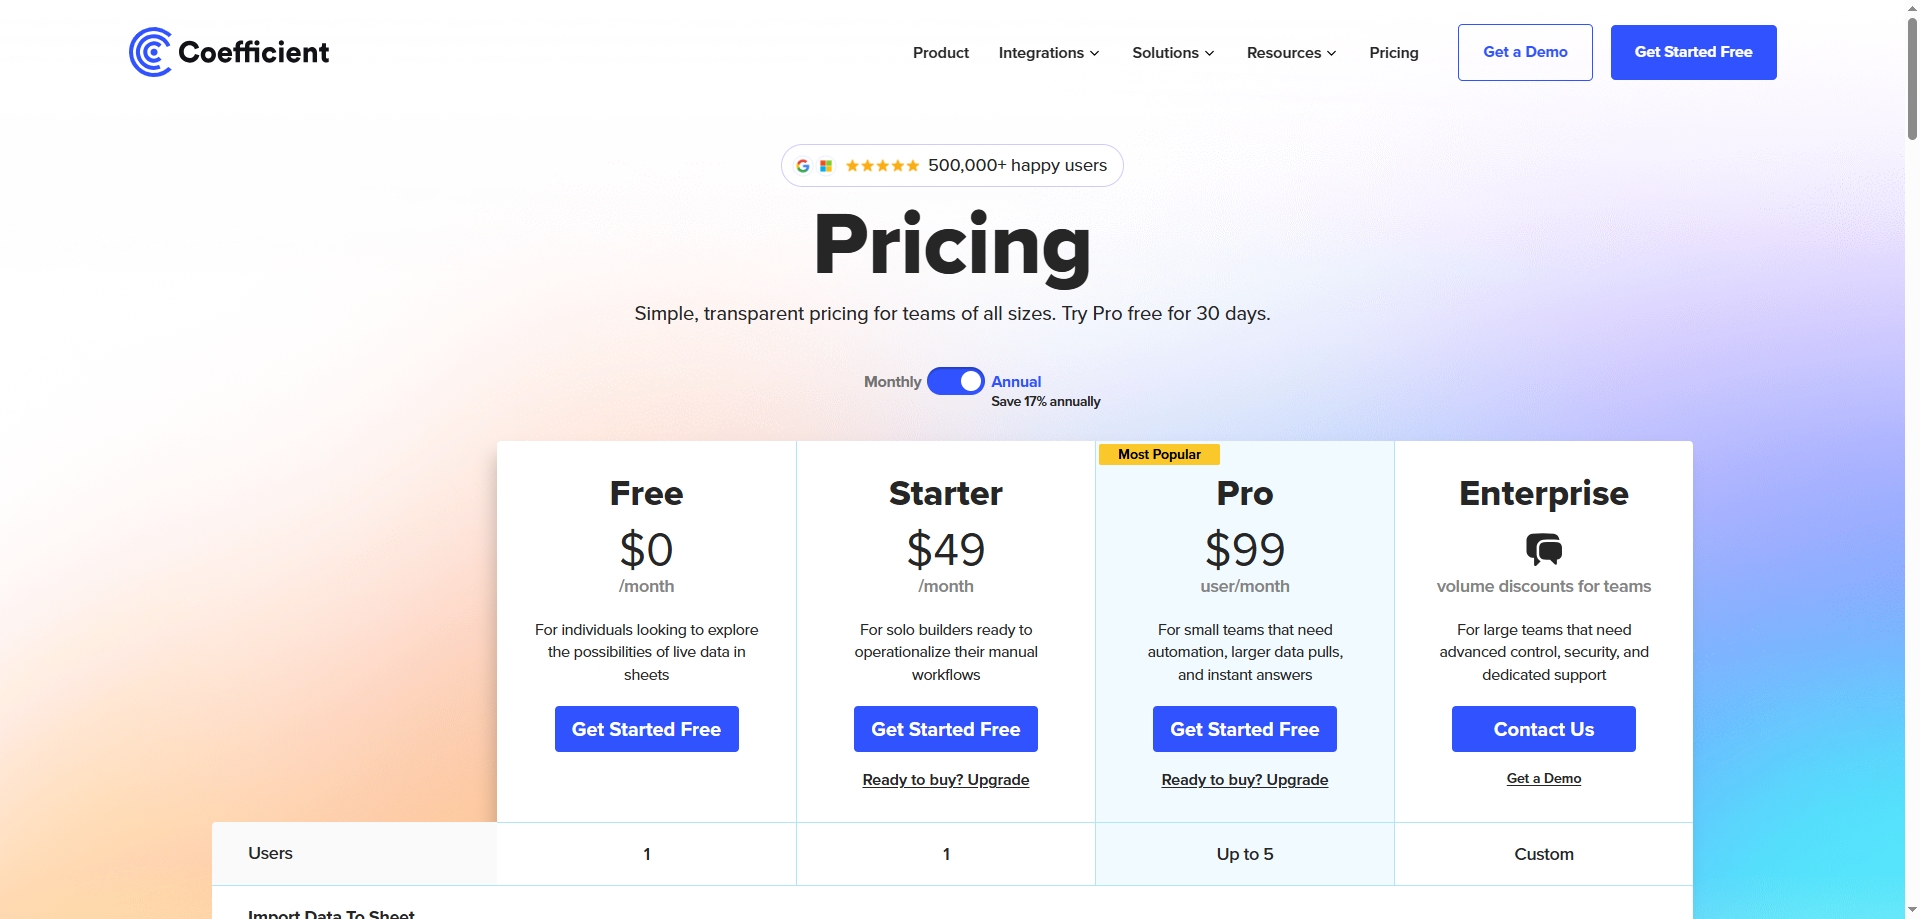
You’re staring at a spreadsheet, wishing it could auto-update from Salesforce, Google Ads, or your internal database. Coefficient makes that happen—without a line of code.
You install it in Google Sheets, pick your data source, and schedule updates. Suddenly your static spreadsheet becomes a real-time dashboard.
It works well as a bridge: prep with Excelmatic, plug in live data with Coefficient, present via Datawrapper.
Pricing: Free plan available, Pro from ~$49/month
Best For: Analysts working in marketing, sales ops, or cross-functional BI
7. Polymer
AI dashboards in seconds, really
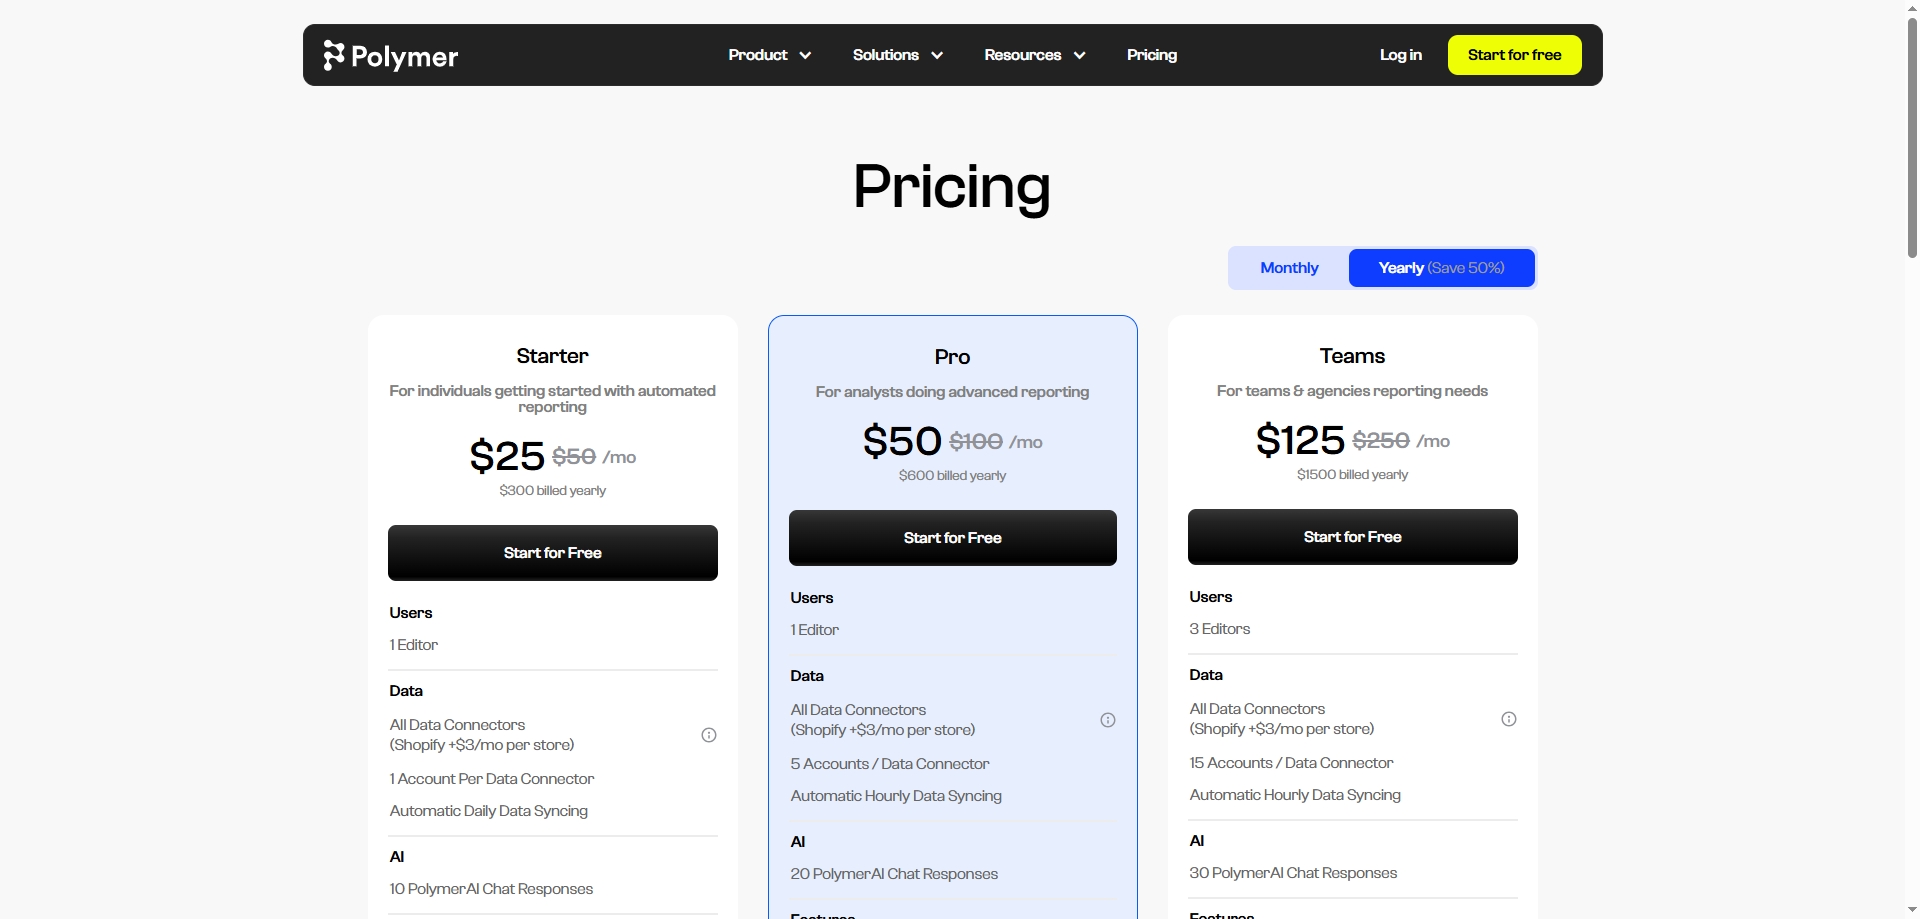
Polymer is a newer tool that lets you drop in a dataset and instantly get a dashboard—with zero setup. It detects trends, creates filters, and makes all charts interactive.
Great for client demos or internal reviews where speed matters more than perfection.
You can use Excelmatic to clean your file first, then Polymer to visualize it on the fly. No code, no pivot tables, no chart tweaking.
Pricing: Free trial available; paid plans from ~$20/month
Best For: Analysts who want quick, interactive dashboards without the complexity of BI platforms
🔁 Wrapping It Up
The best part? These tools aren’t replacements—they’re companions.
Use Excelmatic to prep and analyze data. Use Power BI or Tableau to show trends. Use MonkeyLearn to read the emotional tone. Use Coefficient to keep it fresh. Use Polymer when you’re in a hurry. Use Datawrapper when you want to impress.
In 2025, being a data analyst isn’t about being a tool junkie. It’s about knowing which tools to use when—and building your own stack that works with you, not against you.
And yes, it still starts in Excel.