Tracking sales performance and understanding trends doesn’t have to be a tedious task. While analyzing sales data traditionally involves complex formulas and manual calculations, there’s a way to make the process fast, easy, and insightful. In this article, I’ll show you how you can analyze sales trends using Excel, with simple prompts and without needing to write a single formula.
By the end of this post, you’ll be able to create clear visualizations, compare target vs actual sales, and identify your best-selling products, all in just a few clicks.
The Scenario: Sales Order Data
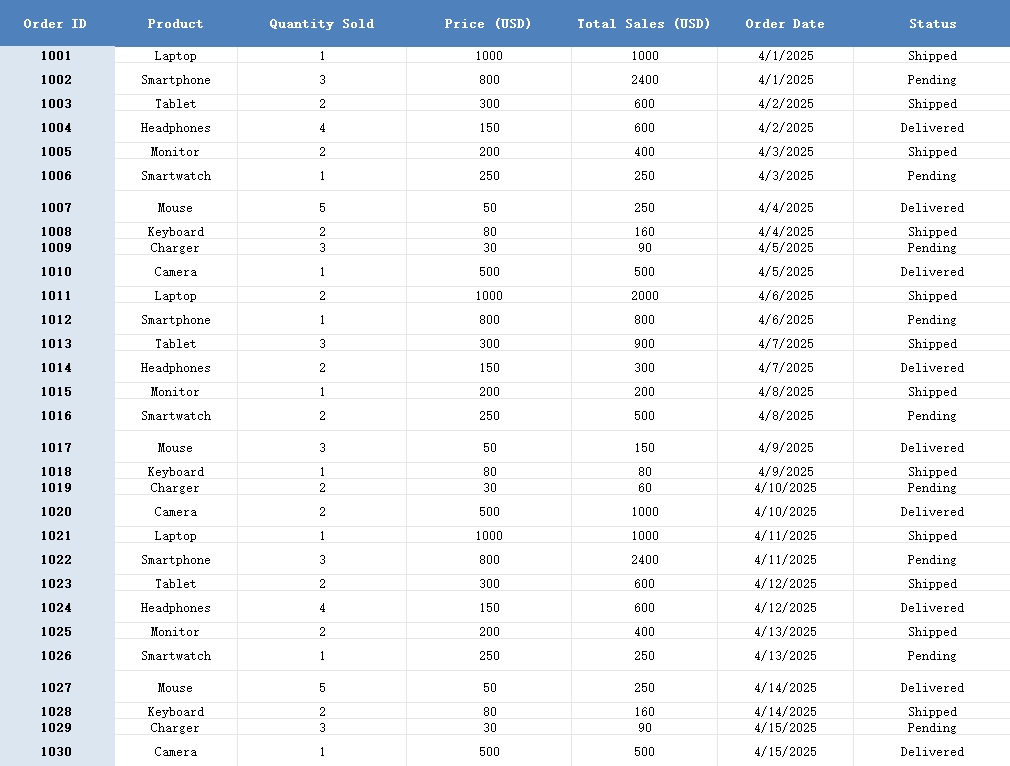
Let’s consider you’re working with sales data from the last month. You’ve received orders for different products—each with quantities sold, prices, and order statuses. Here's an example of what the data might look like:
You have Order ID, Product Name, Quantity Sold, Price (USD), Total Sales (USD), Order Date, and Order Status.
For instance, you might have an order for a Laptop with 1 unit sold at a price of $1000, totaling $1000 in sales. Other products like Smartphone and Headphones are also in the data, each with varying quantities sold and different sales performance. This data is great for tracking and analyzing trends, as well as understanding how each product is doing compared to its sales targets.
How We Analyzed the Data
Step 1: Compare Target vs. Actual Sales for Each Product
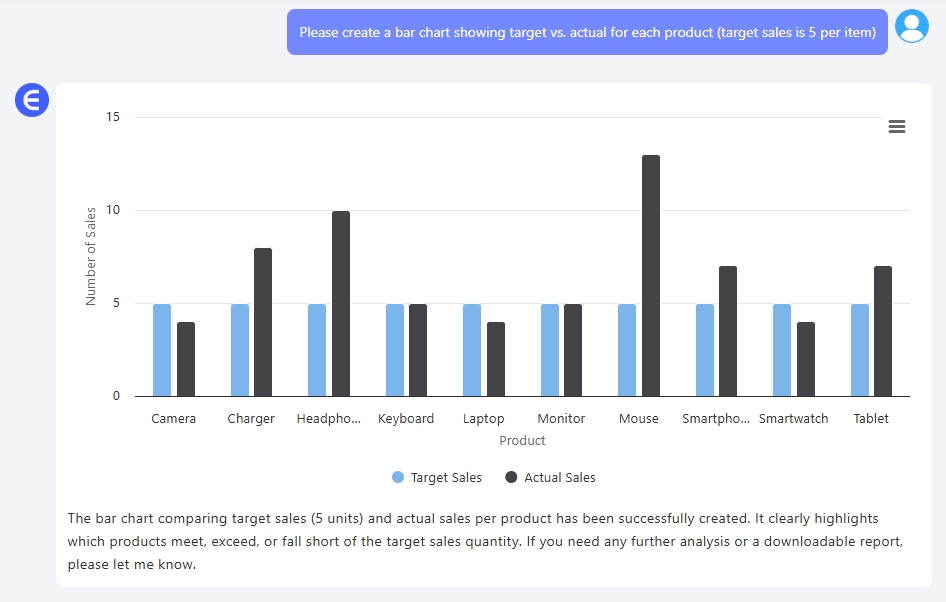
The first thing we wanted to do was see how our products performed against their targets. For example, we set a target of 5 units sold per product. Using Excel, I simply asked Excelmatic to create a bar chart showing the target sales versus actual sales for each product.
The result was a clear bar chart that visually represented how much we achieved relative to our target. We could see that some products, like Laptop, were on target, while others, like Smartphone, performed slightly under the expected sales numbers.
Step 2: Identify the Best Sellers
The next step was to identify which products were the best sellers. I asked Excelmatic to identify the best sellers based on volume and total sales.
The result showed that the Smartphone was our top seller, both in terms of the number of units sold and total sales value. It was clear that this product performed the best across both metrics, which could influence decisions about stock levels, marketing efforts, and future inventory planning.
Step 3: Visualize the Sales Trend Over Time
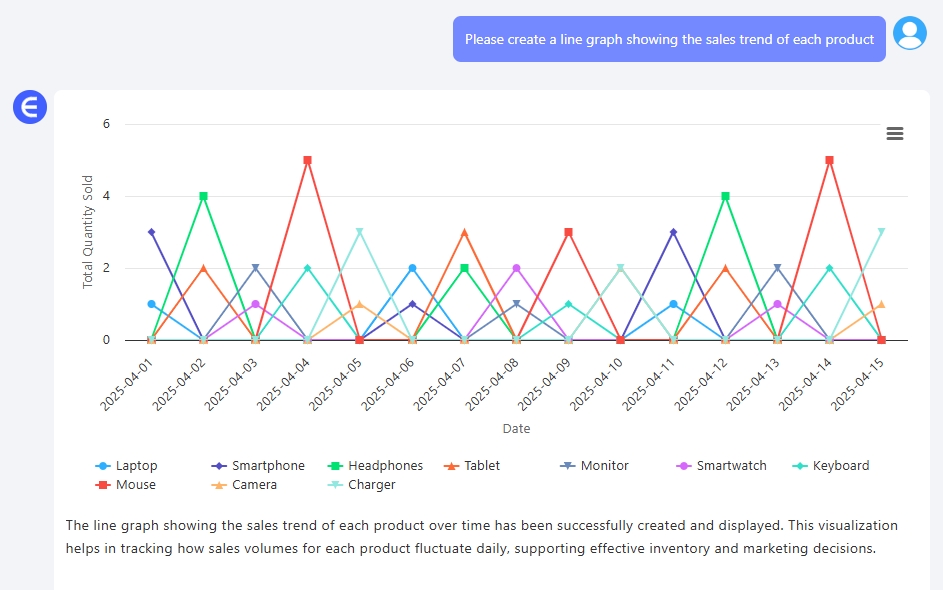
Lastly, I wanted to track how sales were moving over the month. Instead of just looking at raw data, I asked Excelmatic to create a line graph showing the sales trend of each product.
With this line graph, I could easily observe the rise and fall of sales across different products. It became clear which products had consistent sales throughout the month and which ones saw fluctuating sales at different times.
What We Learned from the Data
By asking these three simple questions, we gained powerful insights into our sales performance. We could clearly see which products were on track to meet their goals, which ones exceeded expectations, and which ones might need more attention. The line graph helped us forecast future sales, and identifying the best sellers allowed us to focus more on those high-performing products.
Final Thoughts
The great thing about using Excelmatic is that it lets you analyze your sales data quickly and effectively, without needing to deal with complex formulas or time-consuming manual work. By asking simple questions, you can create clear, actionable insights about your sales performance, allowing you to make more informed decisions for your business.
It doesn’t matter if you’re tracking a small set of products or managing sales across many categories—Excel can turn your data into valuable insights in just a few minutes. So, if you’re ready to give it a try, upload your sales data and start analyzing today!