In today's world, we are surrounded by data. From sales figures and market trends to website traffic and customer feedback, numbers hold the secrets to smarter decisions and groundbreaking insights. But raw data, in its native form of endless rows and columns in a spreadsheet, can be overwhelming and difficult to interpret. This is where data visualization comes in, acting as the universal language that translates complex data into clear, compelling, and actionable stories.

What is Data Visualization and Why Does It Matter?
At its core, data visualization is the practice of converting numerical data into a visual context, such as a map or a graph. The primary goal is to make the information easier for the human brain to understand and process. Instead of poring over spreadsheets, you can see trends, identify patterns, and spot outliers at a single glance. A well-crafted chart can reveal the narrative hidden within your numbers far more effectively than a table ever could.
The importance of this practice cannot be overstated. Effective visualization helps you grasp difficult concepts and identify new patterns, which is crucial for strategic business planning. When you can "see" your data, you can make faster, more informed decisions. Furthermore, it's a powerful tool for communication, enabling you to share your findings with colleagues, stakeholders, and clients in a way that is both engaging and easy to digest.
The Challenges of Traditional Visualization
For years, creating charts and graphs has been a staple of spreadsheet software. However, the traditional process is often cumbersome and unintuitive, presenting several significant hurdles. Users typically face a steep learning curve, needing to master complex menus and formatting options. The process is manual and time-consuming: you must meticulously select the correct data ranges, guess which chart type best represents your data, and then spend considerable time adjusting colors, labels, and titles to make the output presentable. This friction discourages exploration and can feel more like a technical chore than a creative process of discovery. For many, the effort required to create even a simple chart can be a barrier to unlocking the insights held within their data.
And if you want to create more complex visualizations, such as flowcharts or network diagrams, the process becomes even more daunting. You often need specialized software or advanced skills to draw shapes, connect lines, and format everything correctly. This complexity can lead to frustration and a reluctance to engage with data visualization at all.
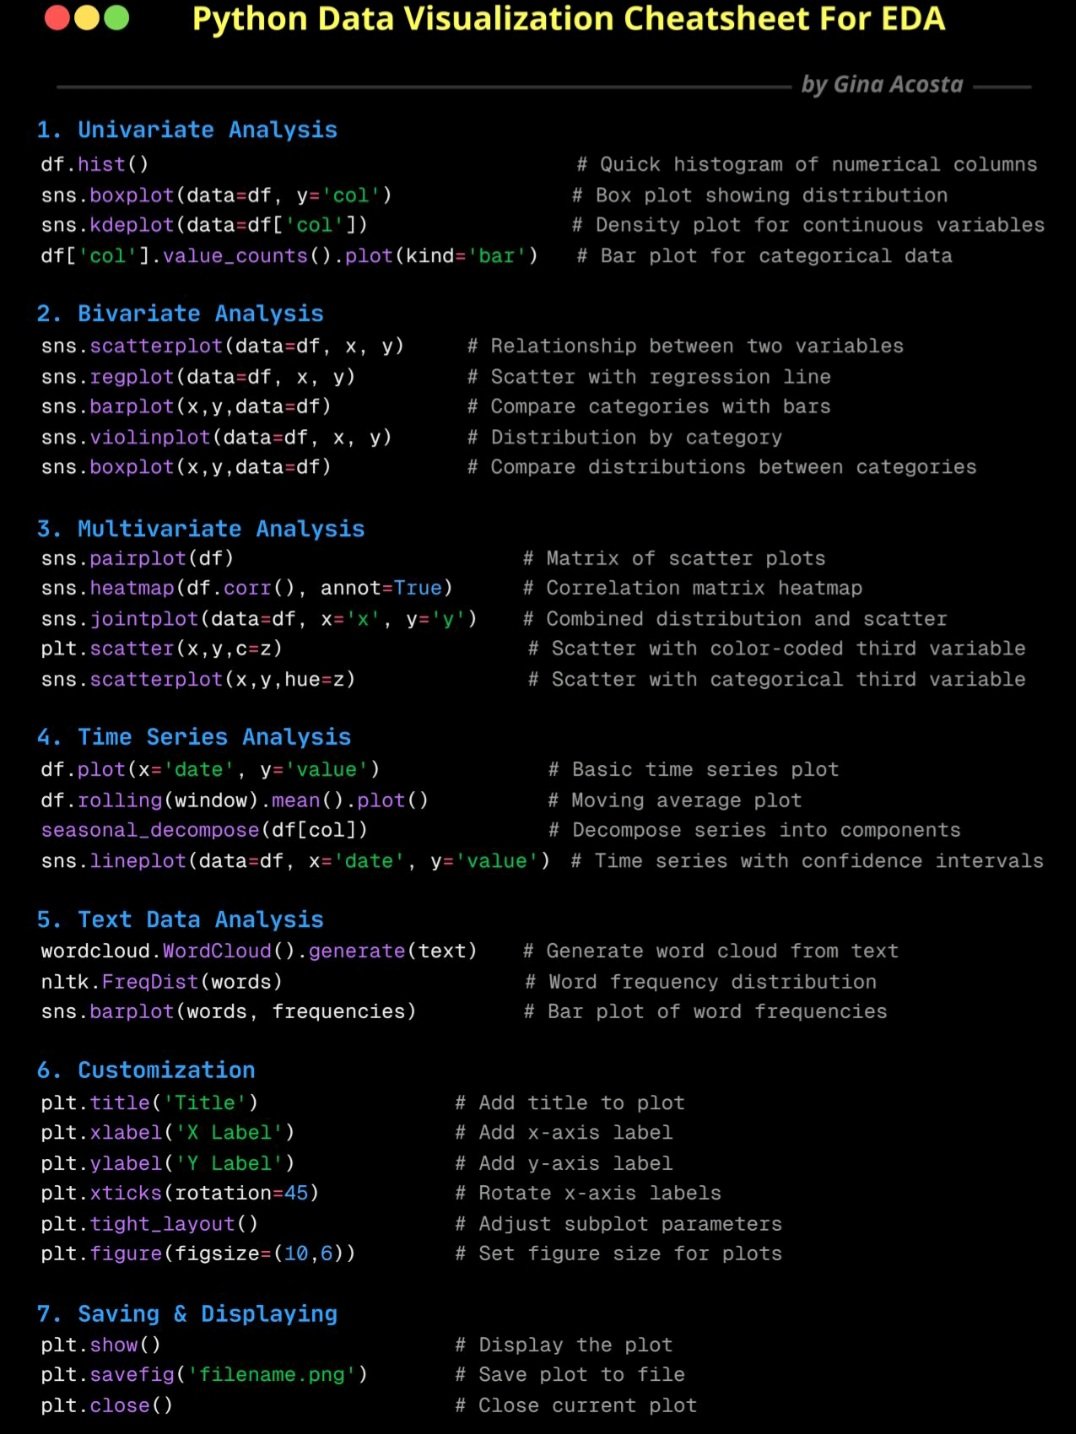
Sometimes, you might write some python code to create the custom visualizations you need, but this requires programming knowledge and can be time-consuming.
The Excelmatic AI Way: Visualization Through Conversation
This is where Excelmatic revolutionizes the entire experience. We believe that creating a chart should be as easy as asking a question. By integrating a powerful AI engine, Excelmatic transforms data visualization from a manual task into an intelligent conversation. Instead of clicking through menus, you simply tell the AI what you want to see using natural language. The AI not only understands your request but also analyzes the underlying data to suggest the most effective chart type, automating the entire creation and formatting process. This shift empowers you to focus on what truly matters: understanding the story your data is telling.
Creating Any Chart Instantly with Excelmatic
Getting started with AI-powered visualization in Excelmatic is remarkably simple and intuitive. There's no need to select data ranges or browse chart menus. You just need to express your goal.
Let's walk through how you can create some of the most common and useful chart types with a simple command.
Crafting a Pie Chart for Proportions
Imagine you have a dataset containing sales figures broken down by different regions: North, South, East, and West. You want to quickly see which region contributes the most to your total sales. With traditional tools, you would need to select the region and sales columns, find the pie chart option, and then format the chart. With Excelmatic, you simply type a prompt like:
Show me the distribution of sales by region as a pie chart.
Instantly, the AI will analyze your data, identify the relevant columns, calculate the proportions, and generate a perfectly labeled and visually appealing pie chart. It understands context, so it knows "distribution" implies a part-to-whole relationship, for which a pie chart is ideal.
The following blogs will help you understand how to create pie charts and other data visualizations using Excelmatic:
Plotting a Trend with a Line Chart
Now, let's say your spreadsheet contains monthly revenue data for the past two years. You want to visualize the performance trend over this period to identify seasonal patterns or growth trajectories. Instead of the tedious process of selecting the time and revenue columns and configuring a line graph, you just tell Excelmatic:
Create a line chart for the monthly revenue trend over the last 24 months.
The Excelmatic AI will recognize the time-series nature of your data, automatically place the months on the X-axis in chronological order, and plot the corresponding revenue on the Y-axis, presenting you with a clean, insightful line chart.
The following blogs will help you understand how to create line charts and other data visualizations using Excelmatic:
Comparing Categories with a Bar Chart
Bar charts are perfect for comparing distinct items or categories. Suppose you have data on the number of units sold for several different products. To see which product is the top performer, you can issue a simple command:
Generate a bar chart comparing the units sold for each product.
The AI will produce a horizontal bar chart that clearly ranks your products from highest to lowest sales, making direct comparison effortless.
The following blogs will help you understand how to create bar charts and other data visualizations using Excelmatic:
Showing Discrete Changes with a Column Chart
While similar to bar charts, column charts are often used to show changes in data over a discrete period. If you want to compare quarterly sales figures for the last fiscal year, a column chart is an excellent choice. You can ask:
Make a column chart of our quarterly sales for last year.
Excelmatic will create a vertical column chart, with each column representing a quarter, providing a clear view of performance fluctuations throughout the year.
The following blogs will help you understand how to create column charts and other data visualizations using Excelmatic:
Visualizing a Workflow with a Flowchart
Excelmatic's AI goes beyond numerical data. You can also create diagrams to visualize processes and workflows. This is incredibly useful for project planning, training materials, or process documentation. To map out a simple business process, you could instruct the AI as follows:
Build a flowchart for our customer support process, starting with 'Customer Submits Ticket', leading to 'Assign to Agent', then 'Investigate Issue', and ending with 'Provide Solution & Close Ticket'.
The AI will interpret this sequence and generate a clean, logical flowchart, saving you the manual effort of drawing and connecting shapes.
The following blogs will help you understand how to create flowcharts and other data visualizations using Excelmatic:
 Data Visualization
How to Instantly Create Pie Charts in Excel with AI Tools
Make stunning pie charts in Excel without touching a pivot table. Learn how Excel AI makes data slices easy to understand and beautiful to present.
 Data Visualization
How to Create a Line Chart Instantly Using Excel AI Tools
Forget manual formatting—learn how Excel AI can create clear, clean line charts in one simple step.
 Data Visualization
How to Instantly Create Bar Charts with Excel AI (No Manual Work Needed)
Stop wasting time building charts manually. Discover how Excel AI can generate clean, insightful bar charts from your data with just one simple prompt.
 Excel Tips
Excel Grade Analysis Made Simple: Visualize Student Performance with Excel AI
Excelmatic turns clunky grade spreadsheets into smart visual dashboards—no formulas, just plain English.
 Excel Tips
Master Cost Structure Analysis in Excel – No Formulas Needed
Still building pivots and charts to analyze your cost categories? Learn how Excelmatic uses AI to break down cost structures instantly and deliver insights you can act on.
 AI Tools by Industry
Top AI Tools for Data Analysts in 2025
Clean smarter, visualize faster, and work better. These are the top AI-powered tools every data analyst should know in 2025—from Excelmatic to Polymer.
 Excel Tips
How to Analyze User Purchase Paths Using Excel AI
Understand how users convert using Excel AI tools. Analyze session trends, traffic source performance, and user behavior without complex formulas.
 Excel Tips
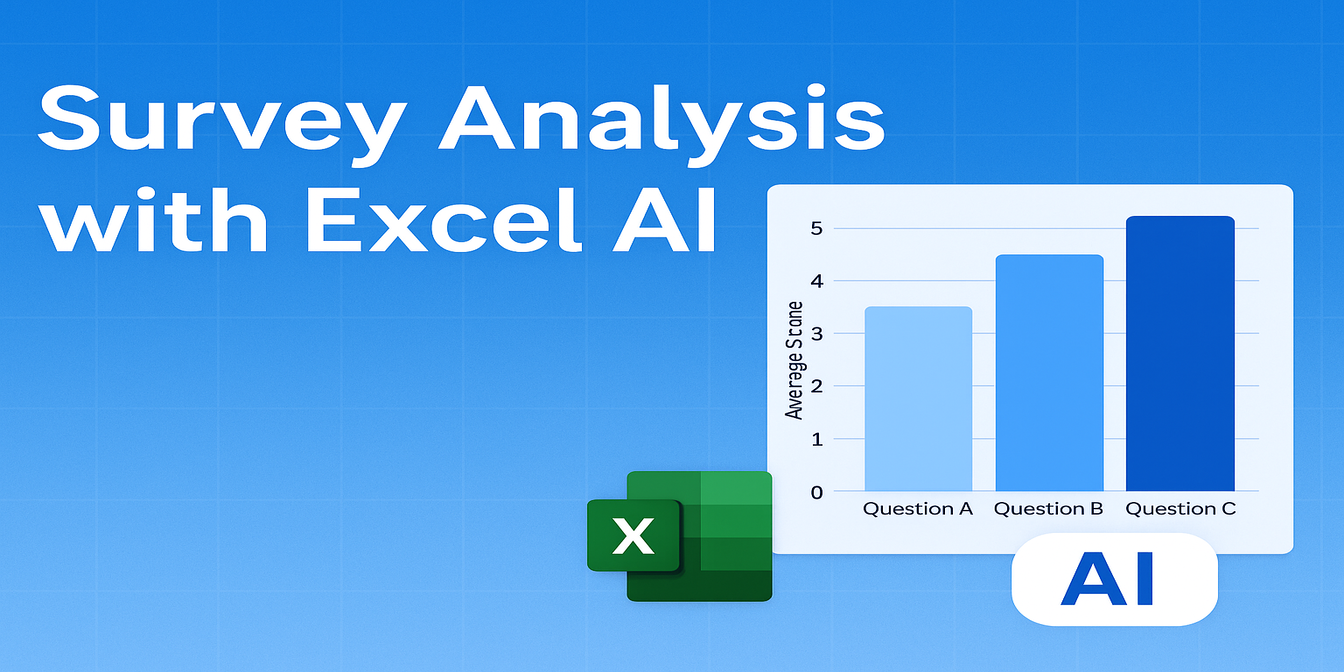
How to Analyze Survey Data in Excel Without Writing a Single Formula
Turn raw survey feedback into visual dashboards and key insights without a single formula. Here's how to analyze survey results in Excel the smart way.
 Excel Tips
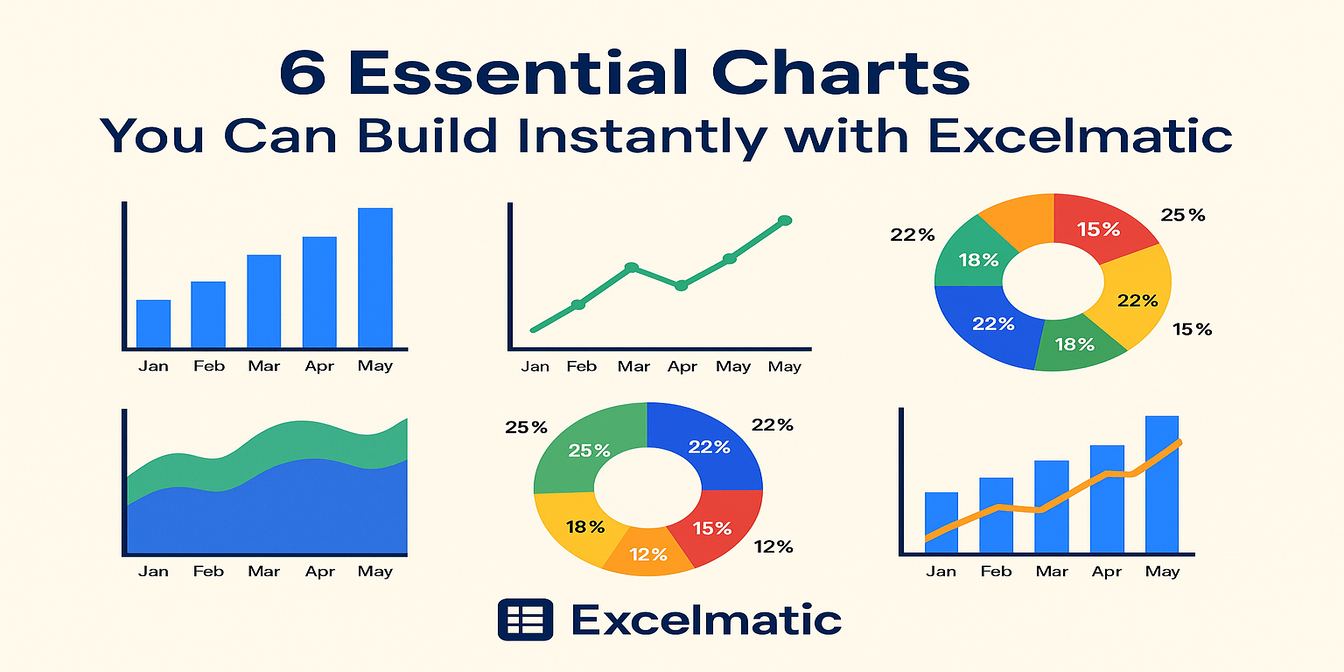
6 Essential Charts You Can Build Instantly with Excelmatic
Learn how I use Excelmatic to instantly create 6 powerful chart types from Excel tables — no formatting, no formulas, no stress.
 AI for Excel
How I Analyze Survey Data Faster with Excel AI — No Formulas Needed
Stop wasting hours on survey analysis. See how Excelmatic helps you clean, calculate, and chart survey data instantly — with just one question.
 Excel Tips
How I Use AI to Quickly Make Spreadsheets — These 3 Tools Save Me Hours
You don’t need formulas to make a report. Here’s how I use 3 AI tools to go from messy data to polished charts.
 Excel Tips
5 AI Tools That Actually Make Excel and Data Work Easier
Sick of writing formulas, formatting charts, or designing slides? These 5 AI tools will change how you work with Excel, data, and presentations.
 Excel Tips
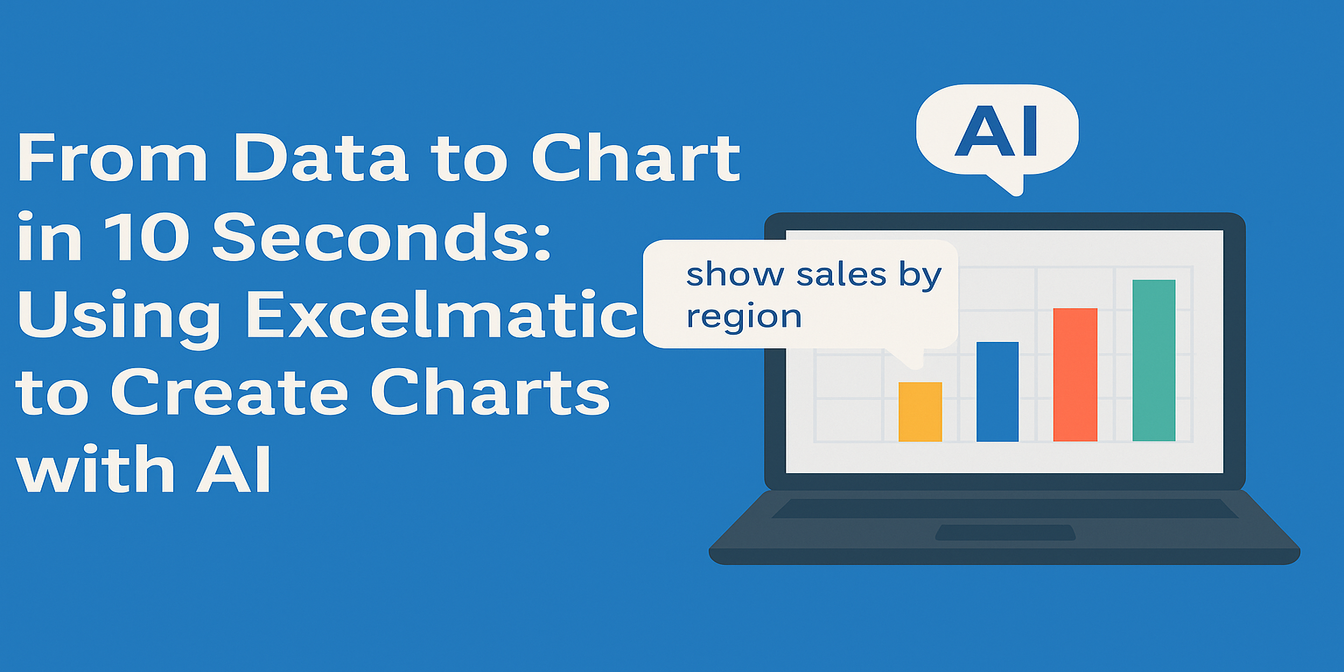
From Data to Chart in 10 Seconds: Using Excelmatic to Create Charts with AI
Manually creating charts in Excel is overrated. See how Excelmatic turns your spreadsheet into polished charts in just one prompt.
 Excel Tips
Let AI Handle Your Excel Charts: A Smarter Copilot Alternative?
Is Excelmatic the smarter Copilot alternative for Excel charts? Learn how this AI-powered chart editor saves you time and delivers better-looking visuals, faster.
 Excel Tips
ChatGPT + Excel AI = A Productivity Powerhouse? Here’s What You Need to Know
Structure data with ChatGPT, visualize it instantly with Excelmatic. This AI combo can seriously boost your Excel productivity.
 Excel Tips
Ditch Your Excel Templates: Automate Data Analysis with AI (ChatGPT + Excelmatic in Action)
Break free from Excel template limitations with ChatGPT and Excelmatic. Learn AI-powered data analysis workflow for dynamic business insights without complex formulas.
 Excel Tips
5 Excel Charts You Can Instantly Generate with AI Using Excelmatic
Learn how to turn your Excel data into charts in seconds using AI. This blog shows 5 real-life examples of pie, bar, and line charts built with Excelmatic — and the insights it can generate automatically.
 Excel Tips
Master Data Analysis with Excelmatic: No Formulas, No Coding, Just Actionable Insights
Transform your Excel spreadsheets into powerful insights with Excelmatic’s AI. No formulas, no coding—just natural language questions and instant results.
 Excel Tips
Excel AI Tool: data analysis in 1 second with natural language!
Excel AI tool: data analysis in 1 second with natural language!
 Excel Tips
How to Perform a Breakeven Analysis with Excel AI
Discover how AI is revolutionizing financial planning with Excelmatic. Learn to perform break-even analysis in Excel using traditional methods and Excelmatic's AI-powered tools. Simplify your financial planning with instant calculations and intuitive visualizations. Read more to see how Excelmatic can transform your business!
 Excel Tips
AI Chart Generator – Instantly Transform Your Data into Stunning Visualizations
Transform raw spreadsheet data into stunning visualizations instantly with Exelmatic AI. No design skills needed – just click and create professional charts effortlessly!
 Excel Tips
How to Create Stunning Excel Charts with Excel AI via Excelmatic
Today, let's explore how to use Excelmatic to quickly create high-quality charts in Excel.
 Excel Tips
Excelmatic: AI-Powered Excel Chart Editor That Brings Data to Life!
Excelmatic helps you gain insights quickly and presents them in the most intuitive way.
 Excel Tips
AI-Powered Excel Data Analysis: Unlock Insights with Excelmatic
Excelmatic leverages AI technology to make data analysis as easy as having a conversation!
 Excel Tips
AI and Excel: Revolutionizing Data Processing
Today, we explore the differences between AI and Excel in data handling, and the unique advantages AI brings.
 Excel Tips
AI Meets Excel: Excelmatic is Here for Smarter Data Handling
Now, Excelmatic, driven by AI, is here to make Excel data analysis simple and intelligent
 Excel Tips
How to delete duplicates in Excel
let me introduce you to a powerful and simple method -- the use of Excelmatic to remove duplicate content in Excel.
 Excel Tips
Excelmatic small classroom: those things that create stunning data visualizations
Today, I will share with you how to use Excelmatic to create a stunning data visualization.
- Excel Tips
E-commerce data analysis is too much of a headache, Excelmatic chart visualization to the rescue!
In the field of e-commerce, data is like a mine of treasures, but at the same time, it is also a big mountain of headaches.
- Excel Tips
Transform Your Excel Data into Stunning Visuals with Excelmatic
with Excelmatic, generating a variety of charts has become incredibly simple and efficient.
 Excel Tips
AI-Powered Excel: Efficiency Boosts So High, Your Boss Will Be Stunned!
with advancements in AI, a tool called Excelmatic has been developed. It brings AI into Excel, making data analysis much easier and more efficient.
With Excelmatic, data visualization is no longer a barrier but a gateway to discovery. By removing technical complexity, we empower every user to transform numbers into narratives and data into decisions, all with the simplicity of a conversation.